Content of the article
- /01 How is KPI related to the overall business strategy?
- /02 Classification of KPI
- /03 Recommendations for selecting and combining indicators
- /04 KPI development: a step-by-step algorithm
- /05 Monitoring tools and automation
- /06 The analysis and correction cycle (PDCA)
- /07 Motivating staff through KPI
- /08 Typical challenges and practical tips
- /09 Trends and prospects for the development of KPI systems
KPI (Key Performance Indicators) serve as a strategic tool for measuring results and improving business efficiency. In today’s environment, when the pace of change is accelerating and competition is intensifying, the ability to quickly track indicators and adjust processes is becoming a key advantage. In this article, we will consider the principles of building a KPI system, their classification, development algorithm, methods of monitoring automation, as well as ways to motivate employees and avoid common mistakes.
How is KPI related to the overall business strategy?
The KPI system should reflect the company’s long-term strategic objectives. One of the most popular tools for building this link is the Balanced Scorecard, which offers four perspectives.
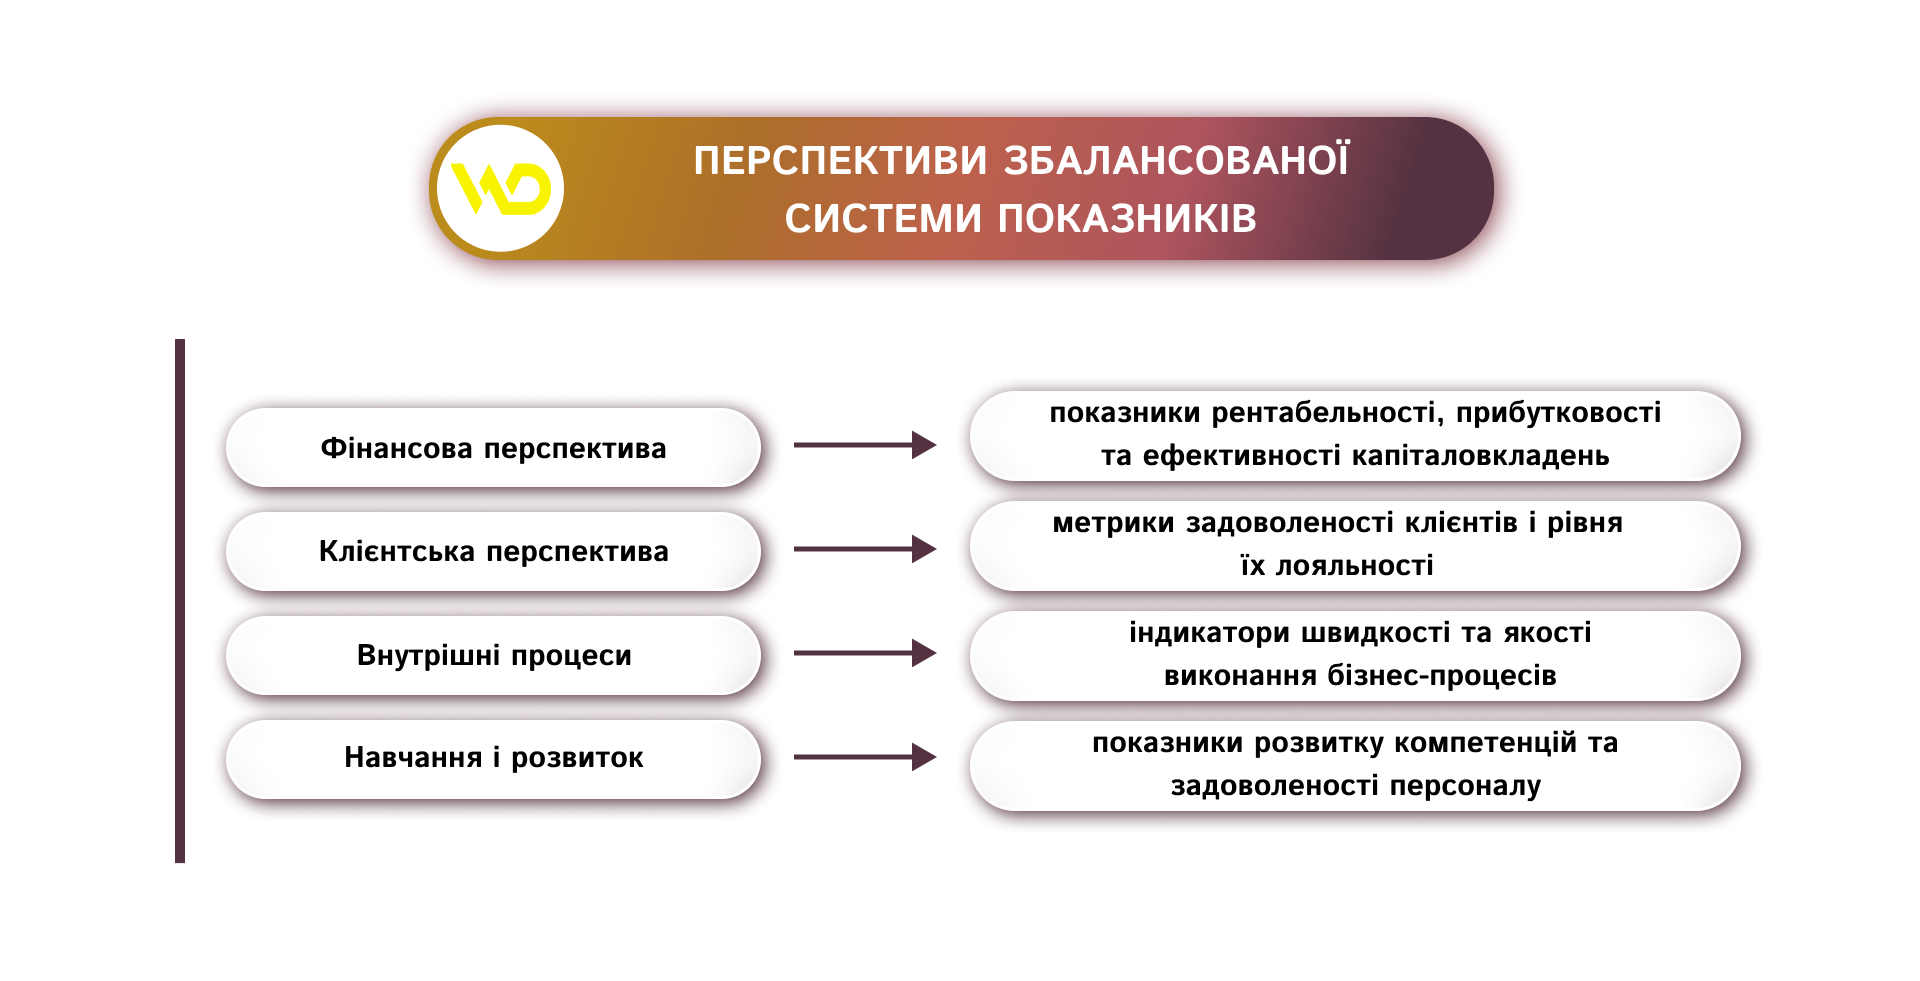
For example, the strategic goal of «increasing market share by 15% in the B2B segment over the year» is reflected in the following KPI: customer satisfaction (CSAT) of at least 85%, average order processing time of up to 48 hours, and a 20% monthly increase in the number of leads. Thanks to this approach, the business owner sees not only financial results but also the factors that shape them.
Classification of KPI
In the business performance management sector, the proper classification of KPI serves as a kind of map that helps you navigate through various indicators and choose the ones that are most important for achieving strategic goals.
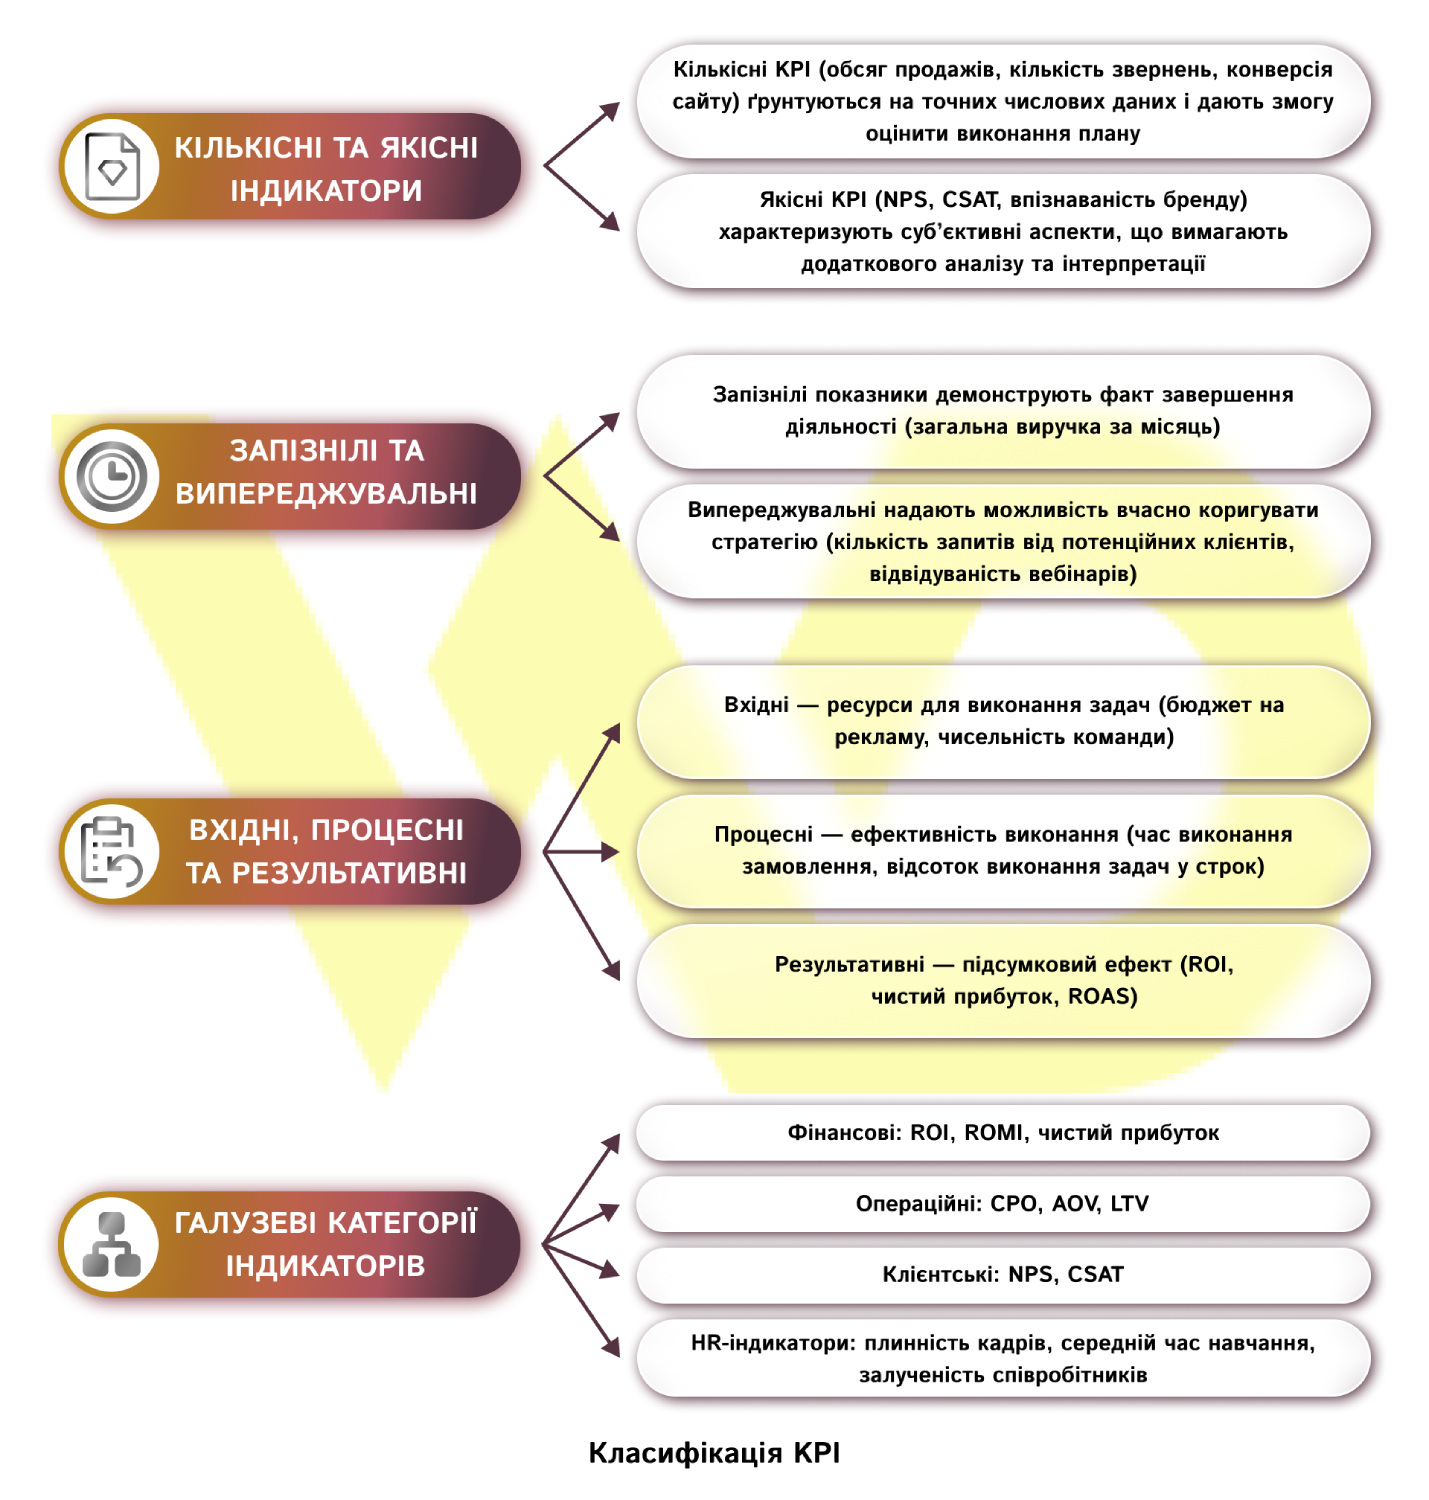
Let’s take a closer look at each group of indicators and the specifics of their application.
Quantitative indicators
Quantitative KPI are based on objective numerical data from CRM systems, analytical platforms, or internal accounting modules. They allow you to unambiguously evaluate the implementation of the plan. For example, an increase in website conversion from 2% to 3% indicates a significant improvement in the effectiveness of marketing efforts.
|
Advantages: quick detection of deviations, easy to track changes over time. |
|
Limitations: do not reflect the quality of customer interaction or satisfaction, sometimes need to be contextualized. |
Qualitative indicators
Qualitative KPI complement the picture of quantitative ones by assessing the level of customer satisfaction and loyalty. The Net Promoter Score (NPS) or Customer Satisfaction Score (CSAT) measures the willingness of customers to recommend a service or product and their overall impression after the purchase. To collect qualitative KPI, surveys are used – both short «pulse» questionnaires immediately after the transaction and in-depth research interviews.
|
Advantages: able to reflect the emotional and image components of interaction, help to find non-obvious reasons for the decline in indicators. |
|
Limitations: subjectivity of assessments, risks of bias, longer data collection and analysis cycle. |
Lagging and leading indicators
Lagging KPI record actual results for a completed period, such as total sales for a quarter or net profit for an annual cycle. They demonstrate how successful the strategy was. However, based on such data, there are limited opportunities for correcting the situation, as the period is already over.
On the contrary, leading indicators indicate trends and risks before the end of the reporting period. These can be the number of new leads, the growth rate of email subscribers, or the time to first purchase. Process participants who monitor leading metrics on a daily or weekly basis receive early signals of deviations from the plan and can react «here and now», for example, by reconfiguring an advertising campaign or changing communication with potential customers.
Input, process, and output KPI
Input KPI reflect the amount and quality of resources required to start or maintain a process: budget for marketing activities, number of employees in the team, available production capacity. These indicators help to ensure that investments and staffing are appropriate before launching an initiative.
Process KPI capture the efficiency of continuous operational cycles. This can be the average order processing time, the percentage of SLA (Service Level Agreements) fulfilled, or deviations from the planned route of tasks. Detailed tracking of this data reveals problem areas and allows you to optimize internal algorithms, for example, by reducing equipment downtime or improving coordination between departments.
Effective KPI demonstrate the final effect of the activity: return on investment (ROI), return on marketing expenses (ROMI), net profit, etc. They summarize the results obtained and provide key insight into how well the initiatives justified the resources spent. The balance between process and outcome indicators ensures that the speed and volume of execution is not accompanied by a decrease in quality or an increase in unproductive costs.
Sectoral categories of indicators
For deeper focus, KPI are divided into functional areas.
- Financial metrics (ROI, net profit, margin) track the economic state of the business and serve as the basis for making investment decisions.
- Operational metrics (CPO, AOV, LTV) optimize the product creation and delivery chain, helping to find the optimal cost/volume ratio.
- Customer metrics (NPS, CSAT, Retention Rate) measure loyalty and repeat sales, which are extremely risky to ignore in a highly competitive environment.
- HR indicators (employee turnover, average training time, engagement rate) help assess the health of the corporate culture and the effectiveness of investments in staff development.
All of these categories, combined into a single system, provide comprehensive control over key aspects of the company’s operations. The right selection and combination of KPI from different groups creates a multidimensional model that allows a business owner to respond quickly to internal and external challenges and maintain a balance between results and processes.
Recommendations for selecting and combining indicators
So, to choose the right combination, you need to consider several factors.
- Balance between categories: combining KPI from different groups ensures a comprehensive view – financial effects, process quality, customer satisfaction, and team health.
- Adaptation to the context: for a startup, leading and incoming indicators are important, while for a mature company, the focus is on process and performance indicators.
- Clarity of wording and data sources: each KPI should have prescribed calculation conditions, reporting frequency, and a responsible person.
- Regular revision: the classification is not static – as the business and market conditions evolve, the composition and priority of KPI should be adjusted.
This in-depth approach to classification allows the business owner to build a well-coordinated management system that combines objective data and qualitative assessments, short-term control and long-term planning.
KPI development: a step-by-step algorithm
In order for a scorecard to work effectively, it is important to follow a clear methodology. Without a structured approach, there is uncertainty in priorities, divergent expectations, and time wasted on reconciling metrics. Below is an algorithm that helps a business owner move from general strategic ideas to specific, measurable KPI.
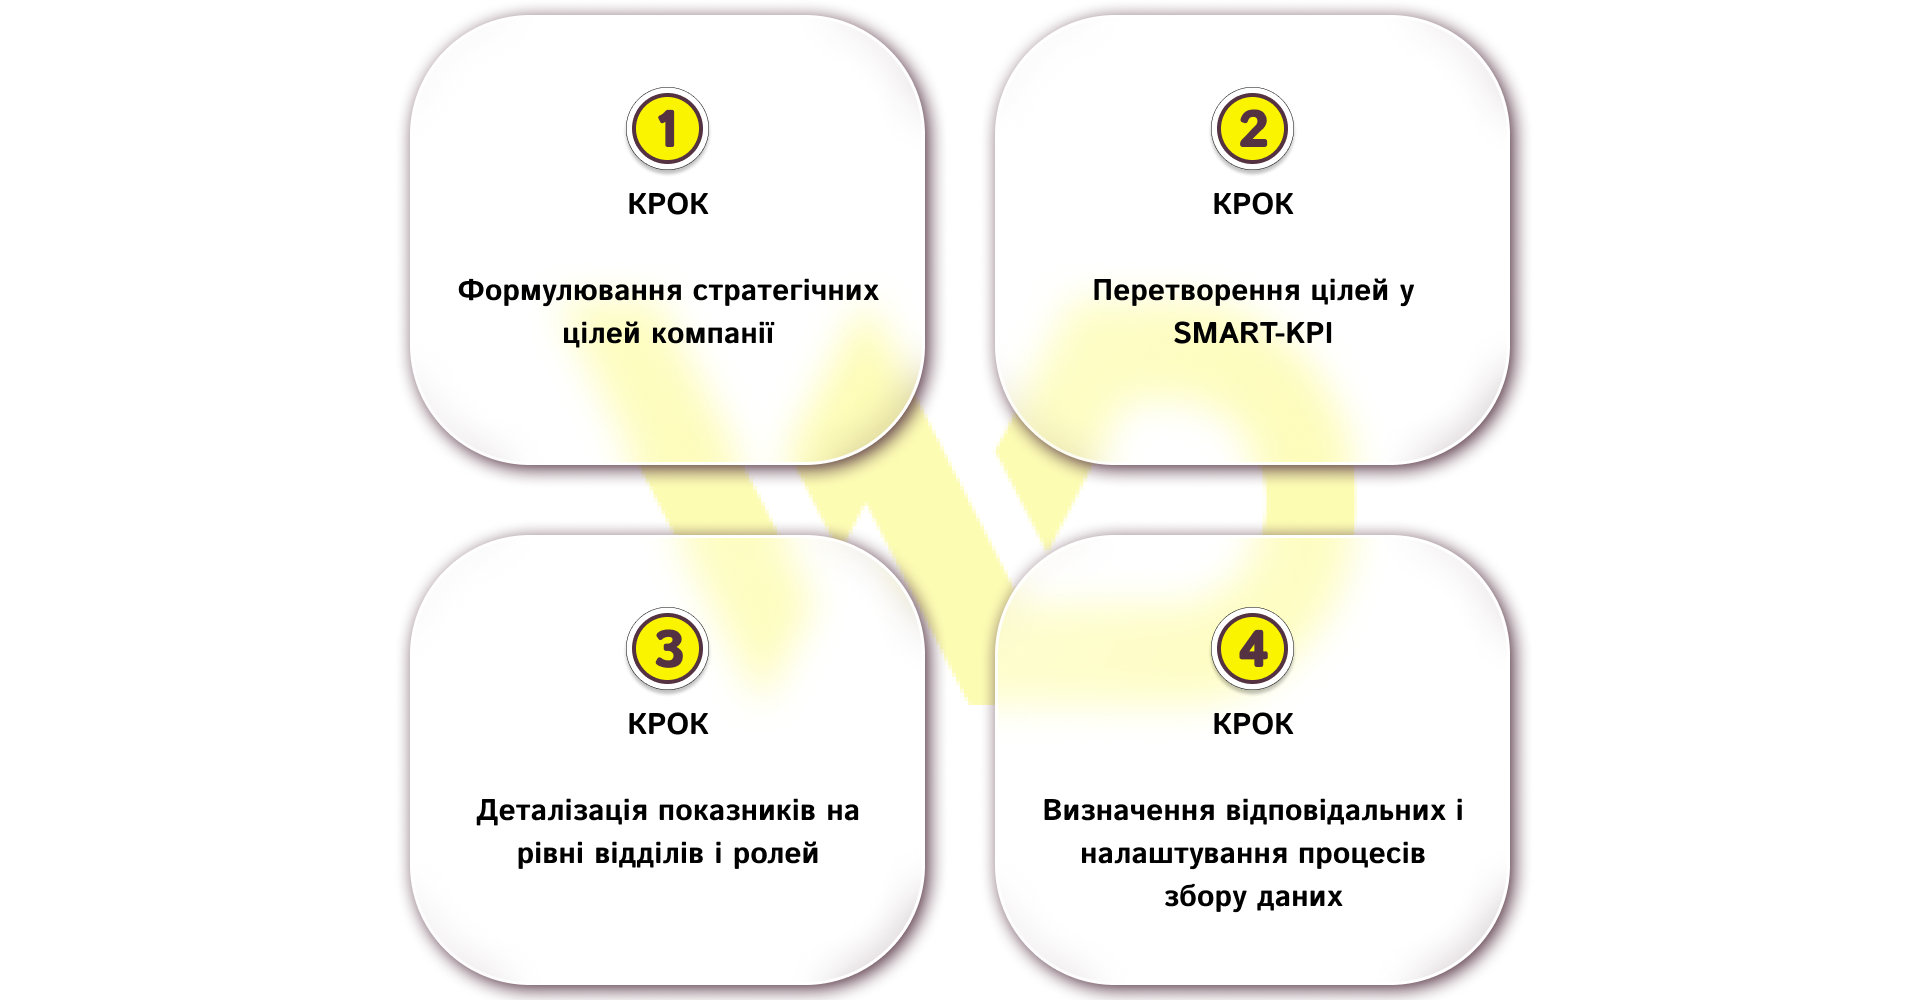
Step 1. Formulate the company’s strategic goals. Here, the emphasis is not just on the desired result, but on a unified vision: what exactly needs to be changed or improved, what customer or financial targets should be achieved. For example, if the task is to increase presence in the HoReCa segment, the goal will sound like «increase market share in this segment by 15% over the next 12 months». Such a goal immediately gives you an understanding of the planning horizon and the scale of changes.
Step 2. Transforming goals into SMART-KPIs. The second stage moves from the general goal to the specifics with the help of SMART criteria. Each goal is checked for specificity, measurability, achievability, relevance, and urgency. While the phrase «increase sales» leaves room for ambiguity, «increase B2B revenue by 25% by December 31, 2025» clearly indicates what should happen and when. This approach eliminates ambiguity and lays the groundwork for further analysis.
Step 3. Detailing indicators at the level of departments and roles. The strategic KPI is decomposed into a chain of sub-goals: the marketing department is responsible for generating at least 500 leads per month, the sales team must convert at least 30% of these leads into deals, and the operations department must fix the processing time for each order in no more than 48 hours. This division guarantees a direct link between daily tasks and the overall business goal.
Step 4. Identify those responsible and set up data collection processes. Each KPI is assigned to a specific person who monitors the quality of sources and the regularity of reports. The sources can be a CRM system, Google Analytics, a BI platform, or an internal accounting module. Regular data audits, such as monthly import correctness checks or comparisons with alternative reports, ensure reliability and avoid «metric» errors.
This approach ensures that each metric is not just measured, but works to achieve strategic business goals.
Monitoring tools and automation
Modern BI solutions are used to ensure timely monitoring of KPI:
- Power BI – integration with Excel and SQL, flexible visualizations for creating dashboards.
- Tableau – intuitive construction of interactive graphs without the involvement of developers.
- Local platforms (Qlik Sense, EasyBI) – comply with Ukrainian data protection requirements and have on-site support.
Automated reporting allows you to set up alerts when KPI are not met: for example, if the average check falls below a certain threshold, the responsible manager is immediately notified. These speeds up the response and reduces risks.
The analysis and correction cycle (PDCA)
After setting up monitoring automation tools and implementing interactive dashboards, the next step is to establish a cyclical analysis and adjustment process that guarantees a live connection between data and strategy. In this context, the PDCA (Plan-Do-Check-Act) model serves as a universal framework for continuous improvement of business processes.
- Plan. New goals are formulated based on historical data and analytics.
- Do. Implement strategies, collect data, and launch processes.
- Check. Compare actual KPI values with targets, analyze deviations, and look for causes.
- Act. Make changes to KPI or processes to avoid repeating mistakes.
The PDCA cycle not only provides a timely response to deviations, but also promotes a culture of continuous development: indicators change with the business, and the team is involved in the improvement process. Let’s take a closer look at how to motivate the team.
Motivating staff through KPI
When employees understand that their efforts are measured objectively, it becomes possible to build a transparent incentive system that increases motivation and fills their work with meaning. The introduction of indicators becomes effective only if they are properly motivated:
- material incentives: bonuses, bonuses, financial rewards for exceeding the plan;
- intangible incentives: recognition from colleagues, certificates, participation in conferences, publications.
Western companies are also actively practicing gamification: employees see their achievements on a «board of fame» and receive badges for success. In Ukraine, such solutions are also gaining popularity, as they help to engage the team in the process.
Typical challenges and practical tips
Even with a well-established methodology for building KPI, the implementation of a performance measurement system can face a number of practical obstacles. Here are some of them:
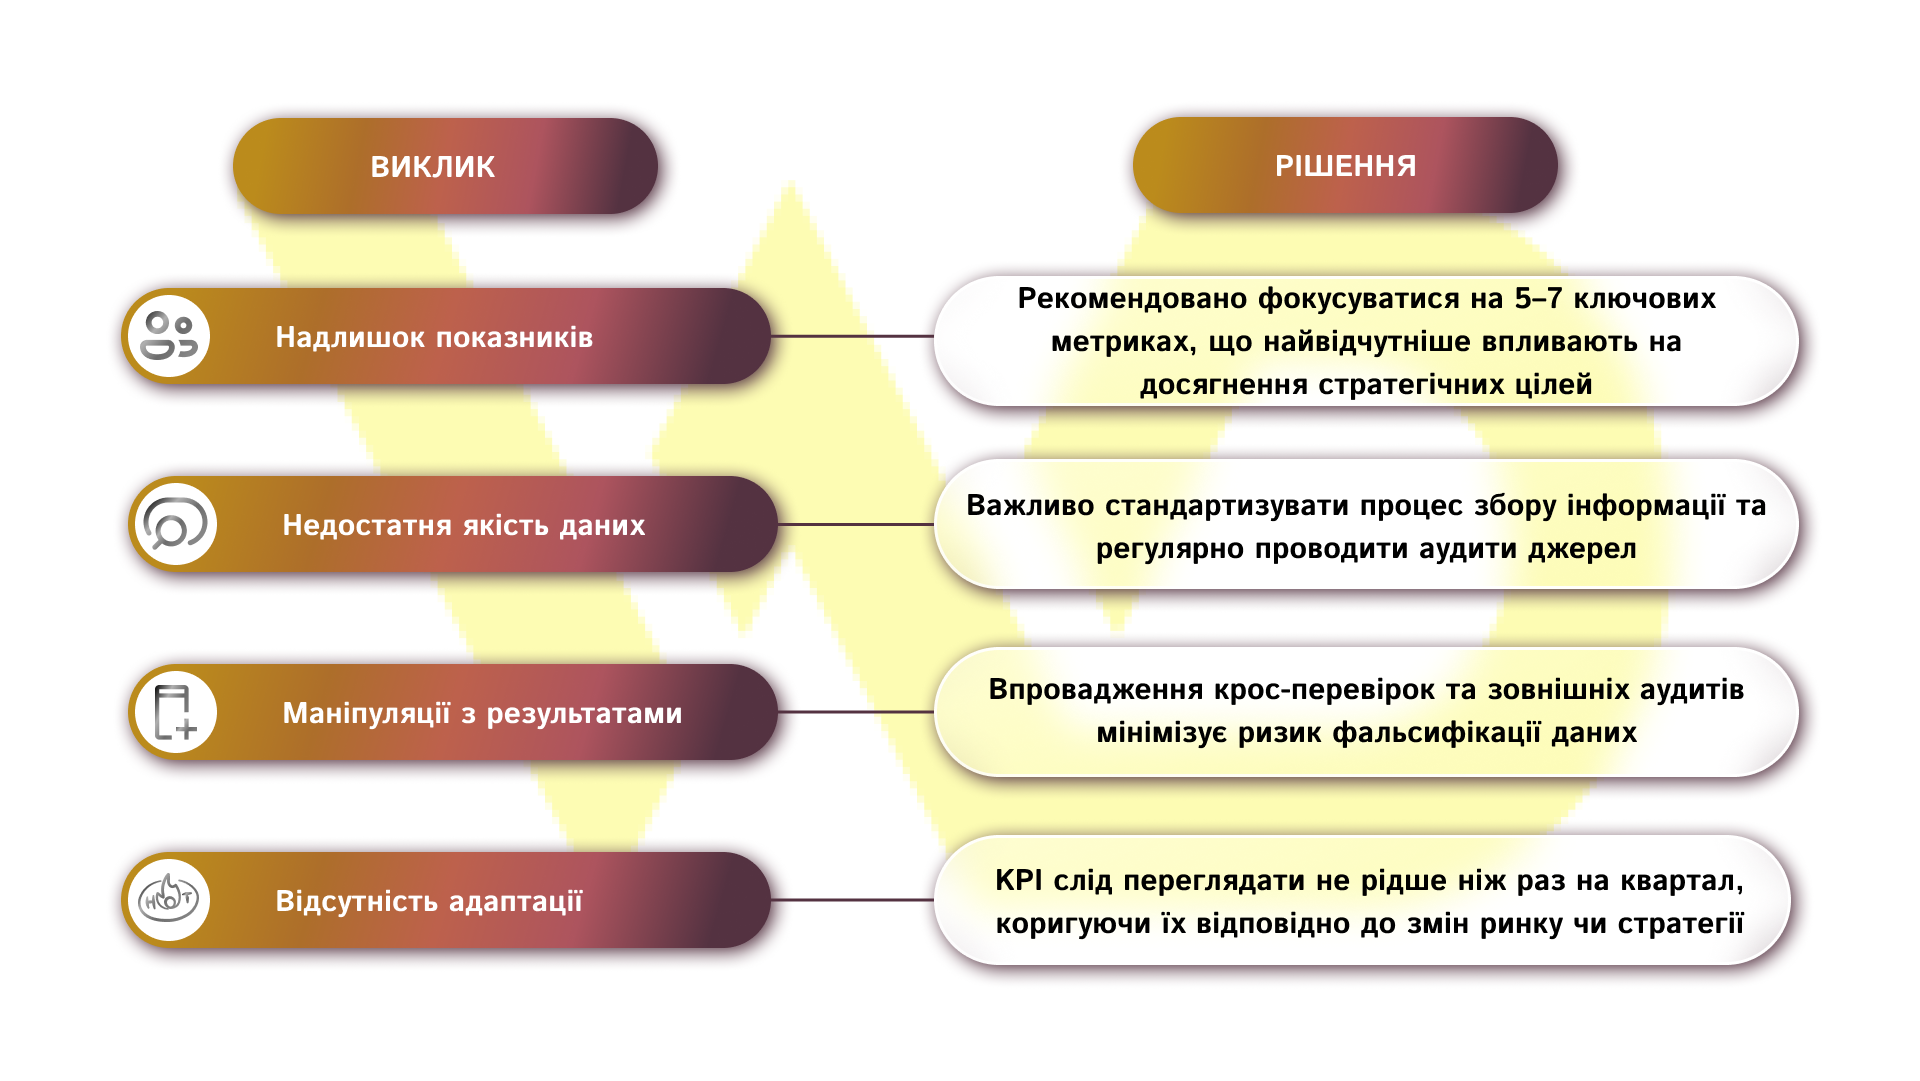
First of all, an excessive number of indicators often leads to a dispersion of attention. When more than a dozen metrics are monitored simultaneously, the team loses focus and management loses the ability to recognize key trends in a timely manner. To avoid this, it is recommended to select up to seven of the most important metrics that are directly focused on the strategic objectives of the business.
Another common problem is data quality. Disparate sources, manual Excel reports, and the lack of uniform accounting standards often lead to discrepancies in numbers and doubts about their reliability. A practical solution is to create a single «KPI register» with clear instructions for collecting and processing information, regular testing of links between systems (CRM, BI, internal databases), and periodic audits by independent experts.
The third challenge concerns manipulation of the results: the desire to get better results can lead to data «recognition» or artificial adjustment of reports. To minimize this risk, it is useful to implement mutual verification procedures when the analytics team regularly compares the results with alternative sources (for example, comparing data from web analytics and CRM), and managers have access to raw data in a format that makes it impossible to make changes without a trace of the change history.
Finally, the lack of adaptation of KPI to new conditions leads to the fact that the indicators remain on paper, and the business loses the relevance of measurements. To avoid this, key metrics should be reviewed at least once a quarter, taking into account external factors such as changes in legislation, currency fluctuations, seasonal fluctuations in demand, or the emergence of new competitors. It is a good practice to develop a KPI checklist that includes validation of data sources, a test for compliance with SMART criteria, and an update of the list of responsible persons.
Given these challenges, the business owner receives a toolkit to identify weaknesses in a timely manner and maintain the flexibility of the measurement system, which, in turn, lays the foundation for sustainable development and growth.
Trends and prospects for the development of KPI systems
Today, KPI systems are moving from the role of a passive reporting tool to an active management mechanism capable of anticipating changes in the business environment. Amidst digital transformation, companies are increasingly using machine learning technologies to automatically detect atypical situations, from a sudden drop in sales to changes in customer behavior. This allows not only to record deviations, but also to predict their impact on key indicators with a significance that previously could only be assessed by analysts.
At the same time, the integration of all business systems into a single ecosystem replaces a large number of disparate tools. Now, data from CRM, ERP, e-commerce, and marketing platforms are merged into single streams, where all relevant indicators are updated in real time. This enables managers to make decisions based on the most up-to-date data, and the role of the BI specialist changes from a «report collector» to a «strategic partner» who generates hypotheses and runs them through the system.
ESG-oriented metrics that support the company’s reputation and meet investor expectations are gaining in importance. Public attention to sustainability and social responsibility encourages business owners to integrate environmental, social, and governance indicators not as a separate block, but as an integral part of the strategic map. This helps build trust among partners, customers and regulators and opens up new opportunities for financing and cooperation.
Personalized KPI that take into account individual strengths and competencies of employees are also gaining ground. Instead of general tasks for a department, the system adapts indicators to specific roles and experience levels, motivating employees to develop themselves and helping to retain key talent.
In sum, the future of KPI systems lies in their ability to become an integral part of an organization’s strategy and culture, where analytics and management gain new depth and flexibility, and data is not just a reflection of the past but a harbinger of success.


 18/09/2025
  1868
1868


