
 22/10/2025
  1452
1452


Інтернет-маркетинг
простою мовою
Content of the article
- /01 What is a Customer Journey Map?
- /02 Why does a business need a CJM?
- /03 When and why to do CJM: business triggers
- /04 Main types of Customer Journey Maps
- /05 How to prepare for creating a Customer Journey Map
- /06 Data sources and research methods for CJM creation
- /07 Step-by-step instructions for creating a CJM
- /08 Common mistakes and how to avoid them
Why does a business need a Customer Journey Map and how to create it

Every day, a customer interacts with a brand through a website, search ads, social media, a call center, and offline outlets – and each of these interactions shapes their decision to buy from you, return, or go to a competitor. Customer Journey Map is a tool that provides a systematic picture of this path. In this article, we will consider what a CJM is, why it gives a business effect, what data and tools are needed, and step-by-step instructions for creating a CJM.
What is a Customer Journey Map?
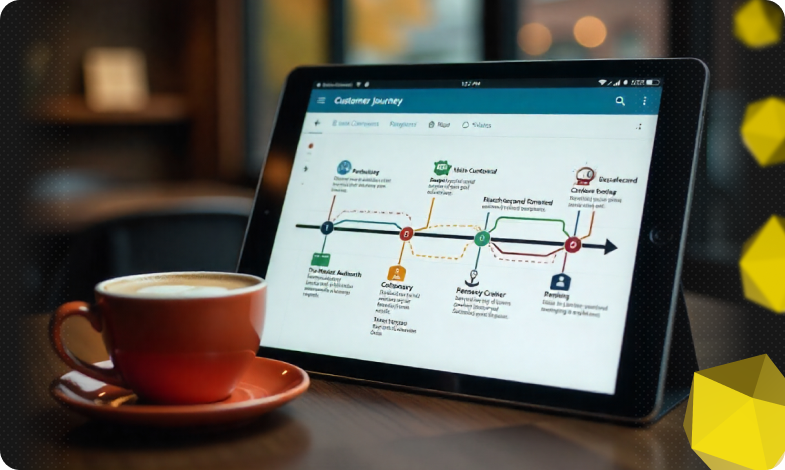
Customer Journey Map (CJM) is a visual representation of the customer’s path from the first contact with the brand to the repeat purchase or recommendations.

The customer journey map differs from the sales funnel in that the funnel focuses on conversion rates, while the map focuses on the customer’s experience and emotions. At the same time, a service flowchart is more of a detail of internal processes and systems. The customer journey map focuses on the customer, but may include internal processes to link business operations to the customer experience.
Why does a business need a CJM?
CJM is a practical decision-making tool that delivers measurable results. It allows you to turn observations of customer behavior and reactions into priority hypotheses for testing and optimization. So, CJM is used to analyze the metrics that we will consider further.
Reducing customer churn and increasing LTV
By identifying and eliminating critical pain points, such as a long wait for a service response or an inconvenient payment process, you increase the likelihood of repeat purchases and the length of the customer lifecycle. To measure the effect, immediately link the changes to group analysis: compare churn rates and average revenue per customer before and after implementing the fixes.
Saving operational costs
The map allows you to save operating costs. The analysis of touchpoints shows which requests are repeated and where it is appropriate to implement so-called self-service (for example, a frequently asked questions section, automatic responses, or chatbots). Automation of routine processes reduces the workload of the support team, shortens the average time to process a request, and reduces the cost of a contact.
Increase conversion rates
When the map reveals problem areas along the way, targeted changes give a quick boost to performance. In practice, this can mean running A/B tests for each hypothesis and tracking step-by-step conversion metrics, bounce rates, and time to complete key actions.
Focus of product changes
You get a prioritized list of initiatives based on the impact-effort matrix – those that have the greatest impact on the customer experience are implemented first. This increases the return on investment in product development and reduces the risk of wasting resources on ineffective improvements.
Team coordination
Working with the map in the format of cross-functional workshops helps synchronize teams: marketing, product, sales, support, and management. Having a common visualization of problems and assigned responsibilities reduces approval time and speeds up the implementation of solutions.
In short, a customer journey map translates abstract assumptions about users into concrete, prioritized hypotheses with defined metrics – and that’s what makes it a valuable business tool for growth, cost optimization, and increased customer loyalty.
When and why to do CJM: business triggers
A customer journey map is most useful when important changes are planned or suddenly occur in the business. Let’s consider typical triggers.

- Launching a new product or entering a new market.
This is a typical trigger for creating a CJM because a new offer or a new location always brings uncertainty. Like other communication channels, there are different audience expectations and hidden barriers to purchase. In such a situation, the map should focus on the awareness and first contact stages, as well as the process of first acquaintance and quick activation – these are the points that determine whether the user will move further down the funnel or lose interest.
For example, instead of making general assumptions, conduct a series of in-depth interviews (10-15) with local users to document their information habits, sources of trust, and expectations. Based on these insights, develop a minimum onboarding scenario and test it on a control group. This sequence is a quick way from hypothesis to measurable result. This means you will get specific data to optimize messages, channels, and the first user experience.
- A sudden increase in bounce rates at the checkout or activation stage.
It signals the presence of a problem area in the customer journey. The map should describe in detail the checkout process and the user’s starting steps. These can include form fields, payment steps, error messages, and time to complete actions. From a practical point of view, it involves conducting a usability test, analyzing heatmaps and session records, and running A/B testing with simpler forms or alternative payment methods. At the same time, basic metrics such as bounce rate, time to complete a task are recorded and regularly compared after changes.
- Business scaling (franchising, new regions, number of outlets).
When scaling, it is important to ensure the repeatability of the best customer experience. That’s why the path map should shift to internal processes, operational logic, and local differences in contact points. Based on the map, create standard operating procedures (SOPs), templates and checklists for new locations, define mandatory service levels (SLAs) and benchmarks for franchisees. It is recommended to conduct a pilot deployment in one or two locations, work out the standards, and only then scale up – this way you will reduce risks and reproduce the expected quality of service faster.
- Interface reform or website redesign, change of communication channels.
Redesigning or changing communication channels changes user expectations and can disrupt the usual ways of interaction, so before a mass release, you need to compare the current state and the planned version of the map. Pay special attention to entry points, transitions between channels, and how the new interface conveys messages and calls to action (CTA). Before the launch:
-
- conduct prototype testing with real users;
- run A/B experiments for key scenarios;
- prepare a rollback plan.
Also, don’t forget to update your analytics system (UTM tags, events) to correctly track the impact of changes on step conversions.
- Deteriorating retention metrics or low activation in SaaS.
If customers quickly abandon or fail to achieve the first product value, it indicates that the time-to-value is too long or the onboarding process is not meeting expectations. The path map should detail the first days of use: registration, initial actions, prompts, access to training materials. Solutions may include simplifying the first experience, introducing interactive prompts, updating the welcome email series, and running a group analysis to test the impact of changes on activation and retention rates.
- Increase the cost of customer acquisition (CAC) when ROI falls.
When the cost of acquisition is rising and the return is falling, a path map helps to identify at what stage traffic exits without converting. Analyze traffic sources, initial points of contact, and the path from first click to purchase to find weak links in the lead generation and interaction chain. Practical actions:
-
- segment metrics by channel;
- optimize landing pages for specific sources;
- reallocate your budget to more efficient channels;
- test changes through A/B tests;
- calculate the LTV/CAC ratio for different segments.
This will allow you to make decisions based on the economics of each channel.
- Operational problems in the service: complaints, long response times, frequent returns.
Systemic complaints and delays in processing requests indicate problems in internal processes that directly undermine customer confidence. In such a situation, the path map should detail the internal procedures for processing requests:
-
- request routing;
- queues;
- level of knowledge of operators;
- logic of returns;
- communication with the client.
Based on the results of the map, create an optimization plan, including response templates, automation of routine processes, employee training, and clear SLAs. Key indicators to monitor are the average first response time, average resolution time, and the share of repeat requests.
If you see at least one of these triggers, start with a small map for one person and a specific scenario. Data collection and analysis should be targeted: for each trigger, define a set of priority metrics and a minimum action plan. This gives a quick business effect and allows you to justify further in-depth research.
Main types of Customer Journey Maps
There is no one-size-fits-all map that is suitable for all cases. The choice depends on business goals, available data, and team tasks. Below are the main types of CJMs.

As a rule of thumb, it’s usually a good idea to start with a current experience map for one key person to capture the current state. Then, as data and team support become available, you can move on to a target experience map or service blueprint, gradually increasing the detail and complexity of the map.
How to prepare for creating a Customer Journey Map
To create a high-quality map, you need a small but inclusive team that will represent key business functions: product, marketing, support, sales, IT/analytics, and a representative of top management (sponsor). This allows you to take into account different points of view and make the map as realistic as possible.
Resources required:
- Facilitator: an experienced workshop moderator who helps the team follow the scenario, avoid deviations, and ensure the meeting is effective;
- data: CRM analytics, survey results, customer feedback, and other sources that allow you to reflect the real user experience;
- tools: digital whiteboards (Miro, FigJam) or specialized platforms for CJM (for example, UXPressia);
- time: usually 1-2 days of a workshop are enough to create an MVP map plus 1-2 weeks to collect and analyze data to fill it.
It is important to clearly define the purpose of the map at the beginning. For example: «reduce the abandonment rate at the checkout stage by 10%». This approach narrows the focus, helps avoid unnecessary detail, and allows you to immediately correlate the map with business results.
Data sources and research methods for CJM creation
For the map to be as close to reality as possible, a combination of qualitative and quantitative methods is needed. This allows you not only to see the numbers, but also to understand the context and motivation of the client.

Examples of interview questions:
- «How did you find out about us?»
- «What prompted you to sign up or make a purchase?»
- «What was the least trustworthy?»
- «What could have made the process easier?»
The combination of qualitative and quantitative data creates a complete picture. For example: the number of comments to the landing page → bounce rate → quotes from interviews. This approach allows you to confirm insights from several sources at once and minimize the risk of false conclusions.
Step-by-step instructions for creating a CJM
Creating a customer journey map is a structured process that is best done in a team session format, and then finalized with the responsible participants. Let’s consider a practical step-by-step algorithm.
STEP 1: Identify the characters (personas)
To start, select 1-2 key people who have the greatest impact on the business. Describe them by name, professional experience, main goals and barriers.
Example: «Anna, 34, working mom, looking for a fast and reliable medical checkup for the whole family».
STEP 2: Outline the stages of the journey
Agree on the basic stages with the team:
«Awareness of the need → Consideration of options → Decision-making → Start of use → Retention → Recommendations».
For B2B businesses, you can add additional phases, such as «Evaluation» or «Purchase».
STEP 3. Gather your touchpoints
At the workshop, write down all the channels and ways of interaction: advertising sources, website, chatbot, operator call, email newsletter. Be sure to include offline experience.
STEP 4. Measure emotions and expectations
Add an «emotional line». For each point of contact, mark the customer’s mood from negative to positive. Use real quotes from interviews – this will help you see where trust is growing and where it is being lost.
STEP 5. Identify problem areas and moments of truth
Hold a team vote to find the most critical points.
Problem points – places where customers lose interest or encounter difficulties. Moments of truth – key interactions that have the greatest impact on their decision to stay or leave.
STEP 6. Describe the internal processes and those responsible
For each problem point, determine which internal mechanisms affect the result: the logic of the CRM system, the speed of the operator’s response, the availability of a doctor or product. Assign responsible persons.
STEP 7. Link metrics to touchpoints
Define performance indicators.
For example: the speed of the first response in the call center directly affects the conversion in the Decision phase, and the number of abandoned baskets in the ordering process is a key indicator for e-commerce.
STEP 8. Generate ideas and prioritize them
Use the impact/cost matrix: implement actions with high impact and low costs first. Collect all the tasks in a list.
STEP 9. Create an action plan (roadmap)
Break the plan into stages:
- quick results (1-2 weeks);
- medium-term (1-3 months);
- long-term (more than 3 months).
Tie the tasks to sprints or key company goals.
STEP 10. Run the pilot and measure the result
Use A/B tests, group analysis, and before/after comparisons. Collect the data in a dashboard so that the team has a single source to check with.
Use effective tools and templates to make your work more efficient.

Customer Journey Map is a bridge between customer expectations and business strategy.
Common mistakes and how to avoid them
Creating a Customer Journey Map (CJM) often seems like a complicated process, but most difficulties arise from common mistakes. To avoid them, you should consider the following points.
- Too detailed map.
It makes it difficult to work with the map. To avoid this, start with an MVP: limit yourself to one person and 6-8 key points of interaction.
- Lack of real data.
This way, the map does not reflect the real user experience. Combine interviews with analytics to get an accurate picture.
- Marketing focus without operations.
If you focus only on marketing, you can miss important stages of the user journey. Invite a representative of the support or operations department to a workshop to cover all the processes.
- Static document.
A map that is not updated quickly becomes irrelevant. Review it quarterly or after significant product or service changes.
- Lack of an owner.
Without a responsible person, it is difficult to implement and measure the effectiveness of the map. Assign a map owner, such as a product manager or CMO, to monitor and keep the document up to date.
Following these tips will make the CJM an effective tool, so consider them on the way in.
And remember that Customer Journey Map is not just about experience design. It’s a business decision-making tool that connects marketing, product, and operations into a common system for improving the customer journey. Start small and give your team the data to make big changes.

commercial offer
Other articles by the author
10/12/2025
At first glance, shortening links seems like a minor detail—a technical nuance that has little impact on results. But in reality, it plays a significant role in digital marketing.

23/09/2025
Content is any marketing material with informational, educational, or entertainment value that shapes the brand image and keeps the audience's attention.

30/07/2024
Indexing is a process where search engine crawlers (spiders) search for new pages on the Internet, analyze their content, and store this information in their index. From time to time, the crawlers return to the already indexed pages to check for changes and update the information.
Latest articles by #Useful tips

17/02/2026
Sitelinks are a set of internal links that Google sometimes displays below the main result in the search results.

28/01/2026
News websites operate in a fundamentally different way than corporate, e-commerce, or service resources.

19/01/2026
Links form navigation for users, transfer page weight in SEO, and determine how search robots scan your resource.