
 27/09/2023
  4124
4124


Інтернет-маркетинг
простою мовою
Content of the article

Analyzing the niche and competitors for starting a business
Very often all entrepreneurs have the question, is it profitable to start a business in this or that niche? How much money do I need to start a business (make a website and at least minimally establish sales)? And is there a point, or will I just be run over by competitors? We will try to give you answers to all these questions.
At the very beginning we need to analyze how high the popularity of this topic and whether the market is growing. What a growing market means – it means that the demand for your product should increase every month (seasonality can be adjusted).
In order to be able to enter a niche and not go bust, with all that said, you need to get into the market before it becomes a hype and the market peaks. If you enter after the market has passed its peak, there is a huge chance that you will go bust.
Let’s remember, for example, spinners – they were sold for 200-300 hryvnias, now no one needs them for 30. Those who managed to enter the niche and get in before the peak of the market growth, those who made money.
Market demand analysis
Demand analysis is an extensive study to examine the desires and capabilities of potential customers to purchase a product, and to determine the factors that influence supply and demand.
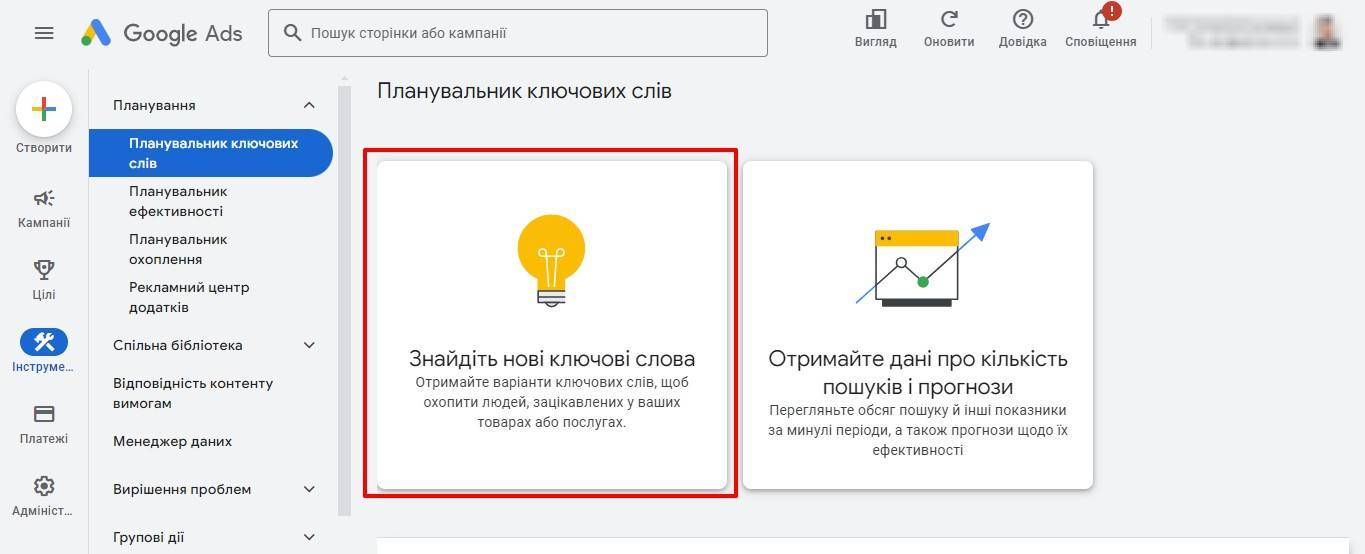
Let’s get down to analyzing the market. You can do this with the help of Google Keyword Planner. Parsing of keyword queries in Google AdWords is done through the Google Keyword Planner nested service:
● Log in – https://adwords.google.com/KeywordPlanner#start under your account
- Go to “Tools and Settings” -> “Keyword Planner”.
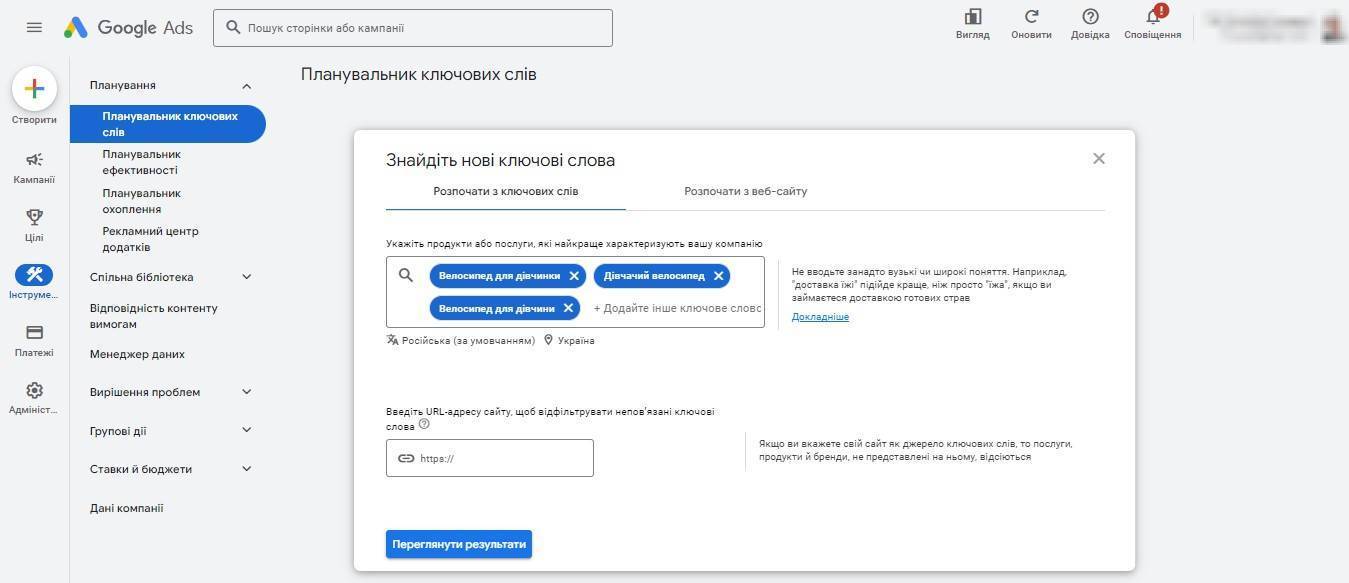
● Select “Find new keywords”.
- In this window, type all our token queries into the search bar, select language and region at the bottom
2. We got the search queries for our tokens. In this window we see 3 areas:
– Add search queries – here Google offers us similar queries among which may be necessary for us, in our case I see the query “bicycle for girls”, we add it by clicking next to the “plus”;
– At the bottom we see the area with search queries;
– On the right we have the filter area, where we can immediately filter out the words that are not suitable for us, in order to remove the queries in which these words are present.
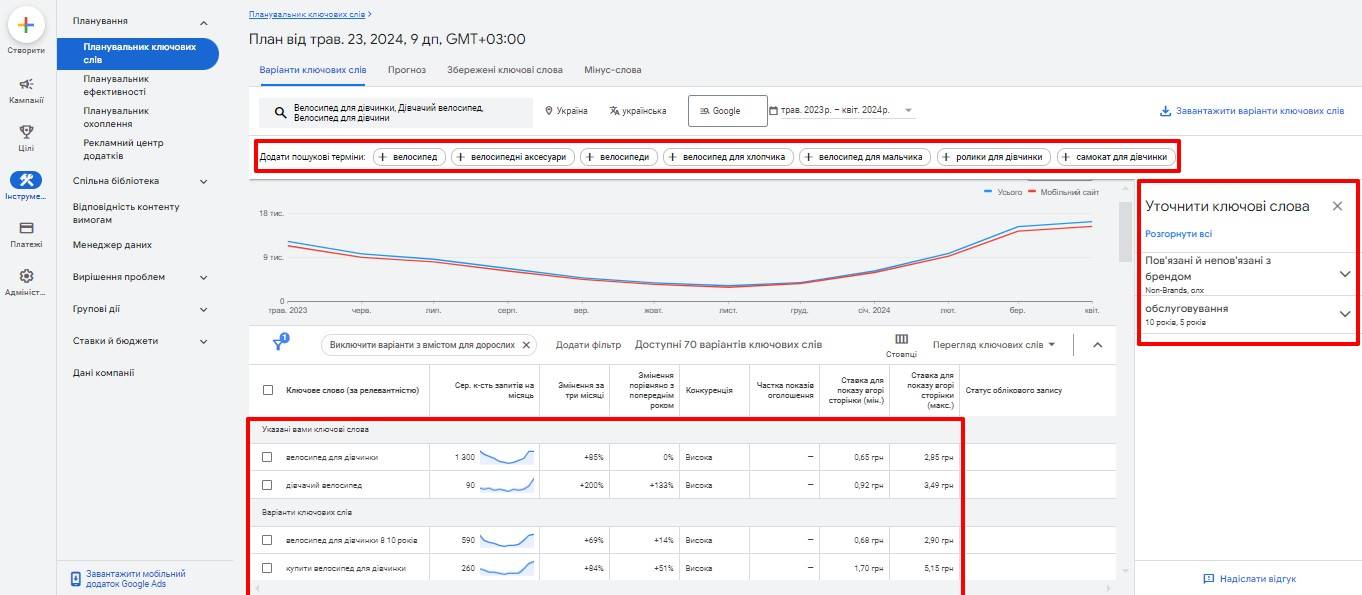
3. We add to our search the query that Google additionally suggests to us – “bicycle for girls”
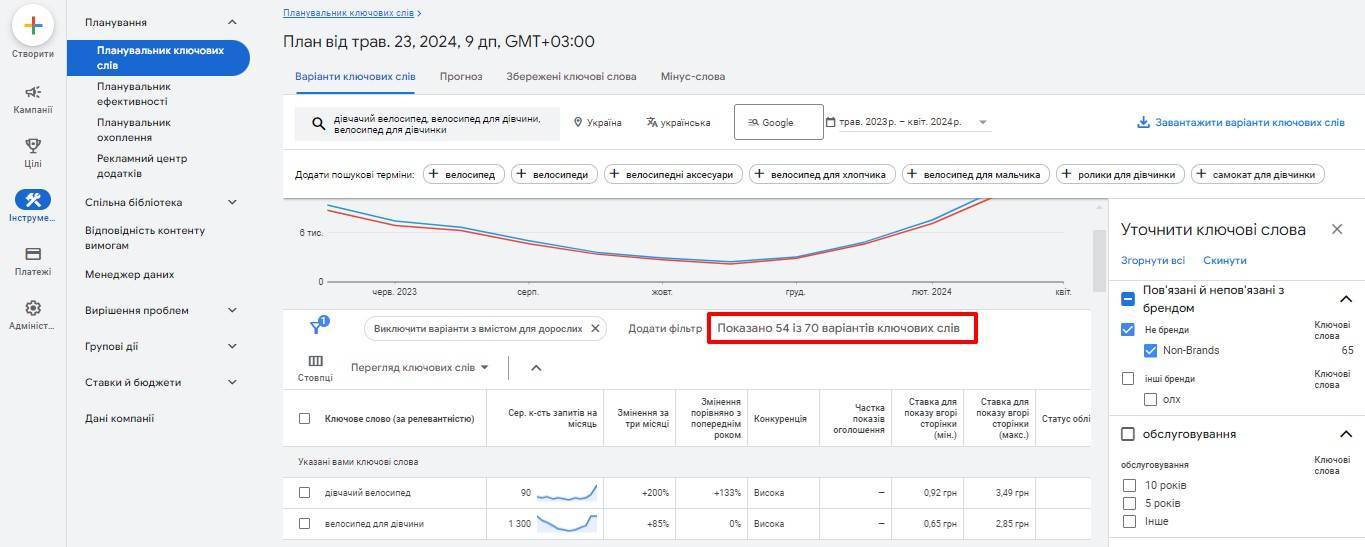
4. Next, let’s filter out all the words we don’t need. Since we need queries only for the page “bike for girls”, the queries with the words “5 years”, “10 years”, etc.” are not suitable for us, these are more refined options, remove them:
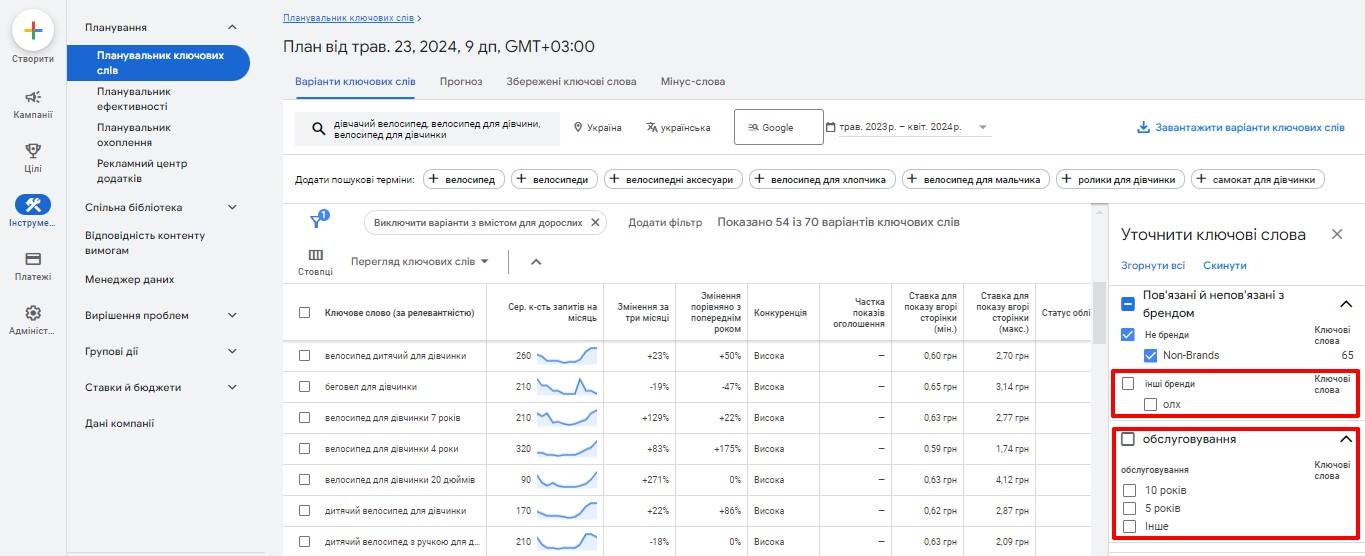
5. The words have been filtered out and we are left with 50 queries out of 66 initial queries:
6. Now download them for later loading into Key Collector
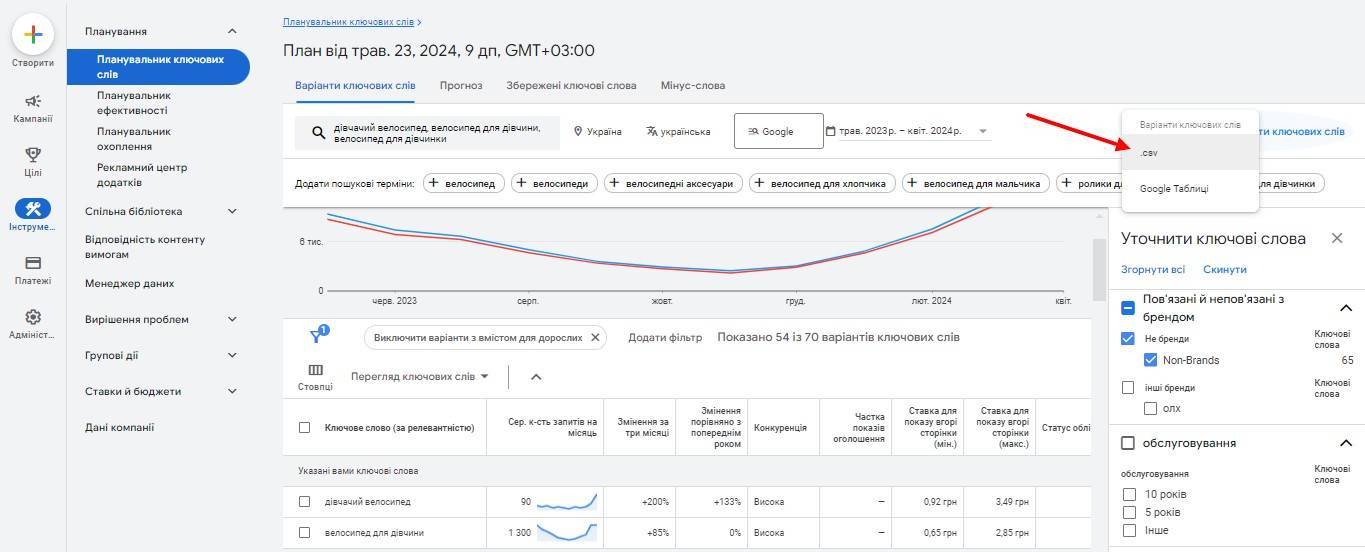
We managed to find only 50 queries through Google, so we move on to searching through Ahrefs and Serpstat.After you have done everything and uploaded the finished file, you can move on to its design and analytics. Format all the column headings nicely and start working with the numbers.
Seasonality table analytics
First, for each month, let’s calculate the sum of frequencies for all queries. Let’s do it under the columns with data using the AMOUNT operator
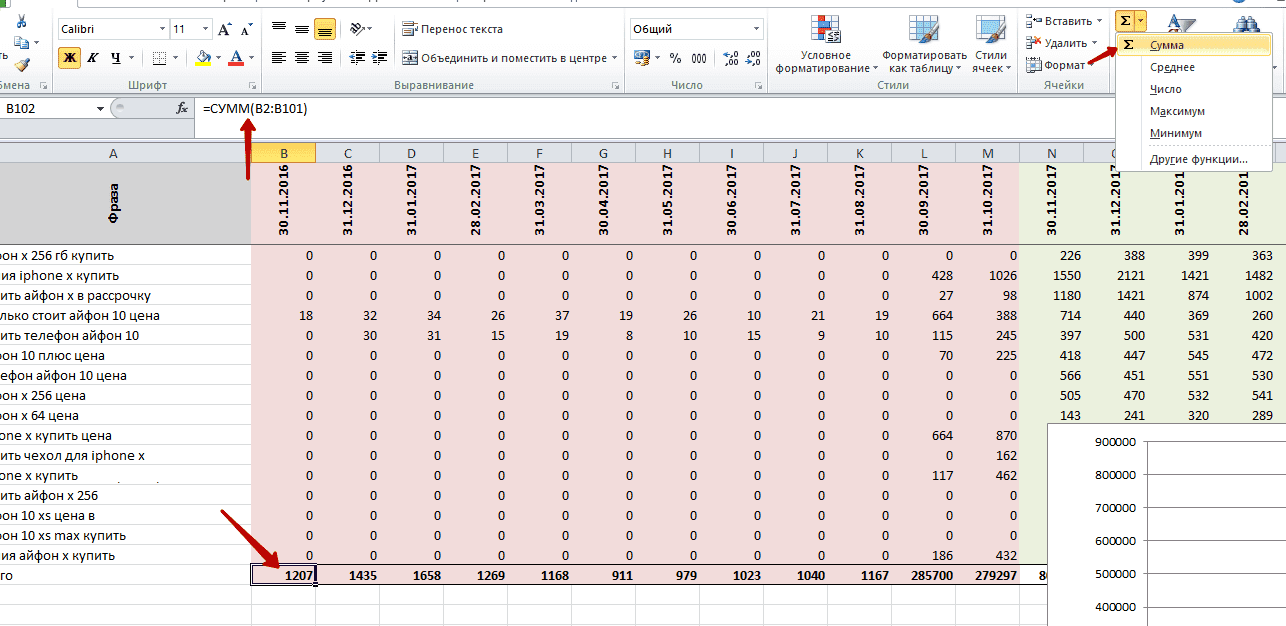
Summarizing the frequency of queries
This data will show how interested customers are in this niche. You can plot them on a graph to understand trending. Select the cells with sums under the data and plot the graph.
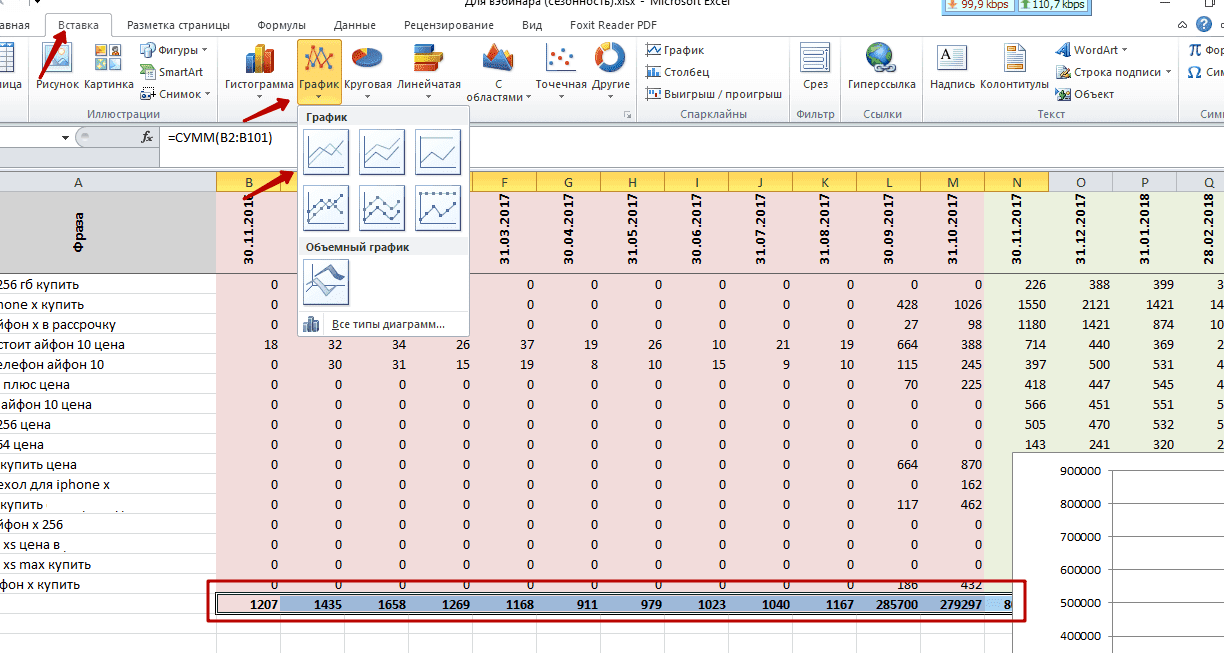
Creating a seasonality chart
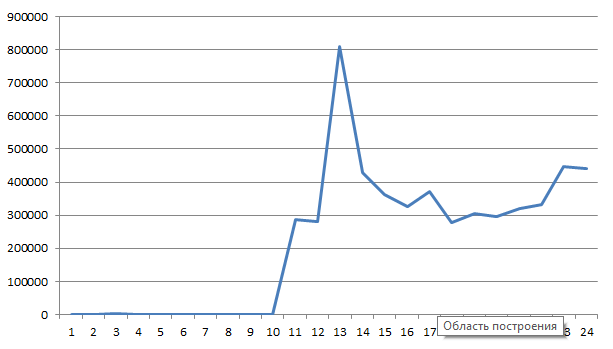
According to the graph, we can see that the peak of requests for iPhone 10 has already passed, but now there is still an increase. What this is due to – we will understand later.
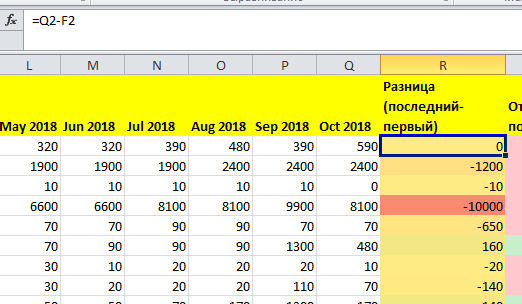
So, to understand how much demand has grown this year compared to last year, we sum up the values for 12 months of the previous period and 12 months of the current period, and then calculate the difference between them to understand how positive the dynamics and whether there is growth, or is already falling.
You can highlight the positive difference in green, and the negative difference in red.
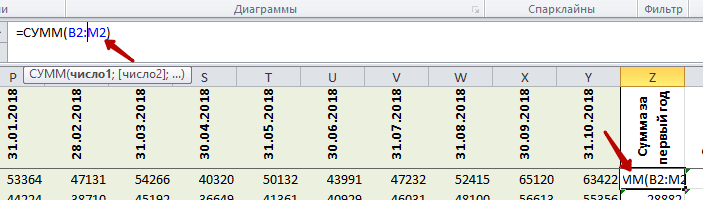
Summation of frequencies for the first year
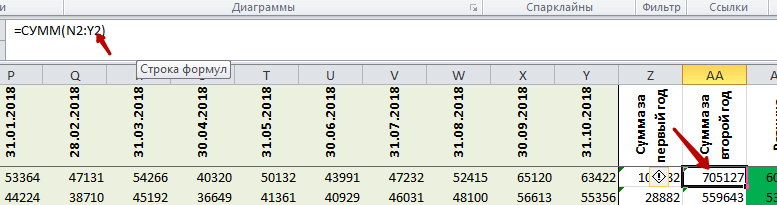
Summation of frequencies for the second year

Computation of the difference for two years
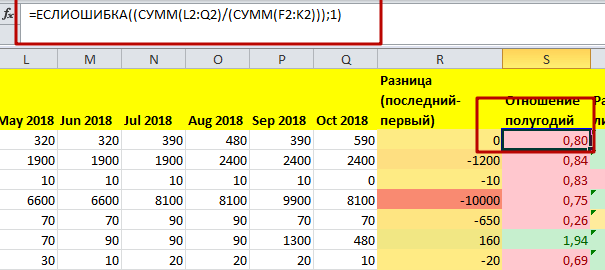
It is also very important for us to understand how much demand has grown, so we will find the ratio of the sums of frequencies for the second year compared to the first year. This will give us an idea of the scale of growth.
But keep in mind that the query may be new and it had no frequency 2 years ago (equal to “0”), and we cannot divide by zero. Therefore, it is necessary to take this into account in the formula.
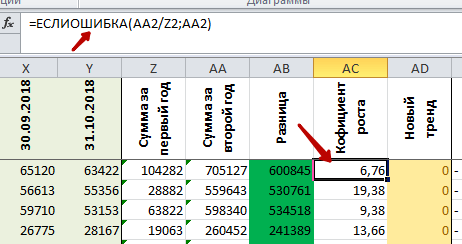
Taking into account the possibility of division by “0” using the “IF ERROR” function
After you’ve calculated the Ratio, we have some queries in the table that show a huge growth factor – these are new queries. They led to the second jump.
Now we need to isolate these queries and understand which of them gave a new trend.
Here we need to evaluate the new trend by 2 criteria:
First – if the frequency for the first period is “0”, and for the second period is greater than “0”, then it is a new query that has just appeared and can mean that it is a new trend.

Checking for a new trend
The second is if the growth of the query is greater than the average growth of all queries.
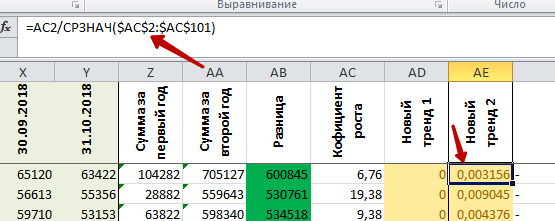
Checking for above-average height
If at least one of the conditions is met, we output this query. And you can perform separate analytics on them.
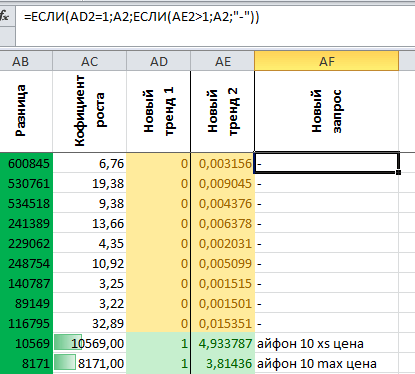
Showing promising search queries By unloading seasonality, we gained an understanding of which queries are now trending upwards.
Analysis via Google Ads
The second tool that will allow you to analyze the seasonality and trending of queries is Google Ads. Recently, Google has also started providing query frequency data for the last year when collecting keys.
In order to collect keys under Google, you need to have an Ads account with ads running, otherwise the data will not be collected correctly.
Go to the account and choose to search for new keyword queries. Even at the stage of key selection by the service you can see graphs on the queries.
Query frequency graphs
So, we unload the file and go through the queries we need.
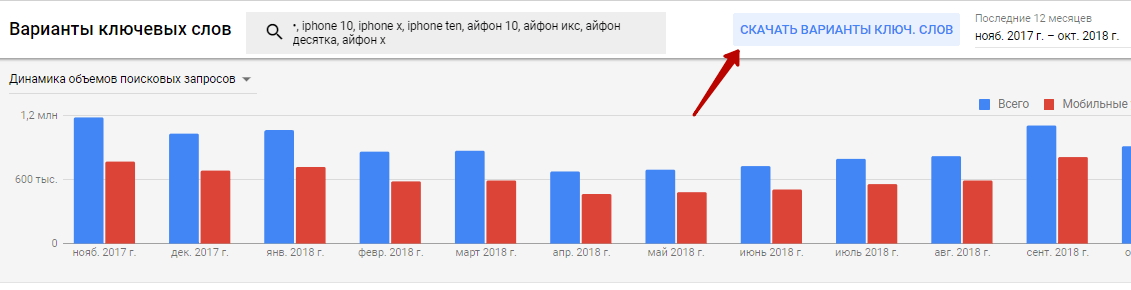
Button for downloading queries
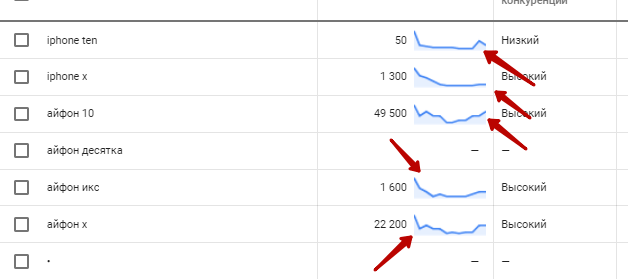
After you have crawled the semantics on the download you can evaluate several parameters:
- Query Competition. This figure shows how much advertising is set up and run for a given query.
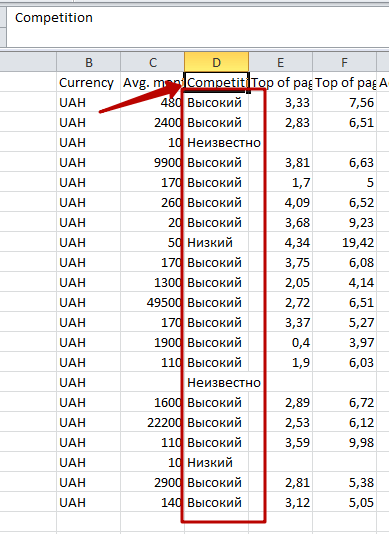
On-demand competition in contextual advertising - Approximate price of a click in contextual advertising. It is useless for calculating the cost of context, but as an approximate cost it can be taken.
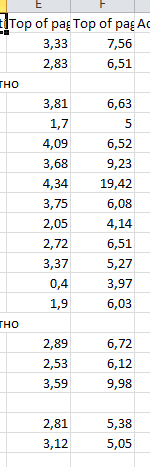
Approximate price per click
3. Monthly frequencies for the last year.
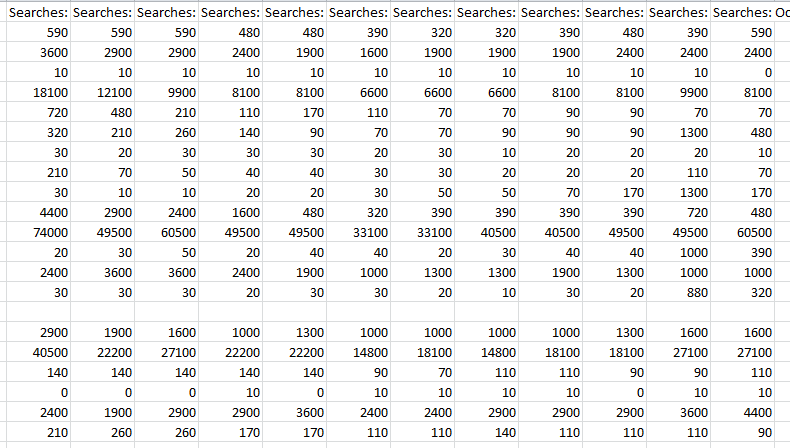
Frequency history by month
Due to the fact that we only have frequencies for the last year, it is very difficult to do more in-depth analytics. But still, we can get some data from this table. Let’s calculate the sums of requests by month.

The sums of frequencies by month
And plot them on a graph to understand the general type of trend.
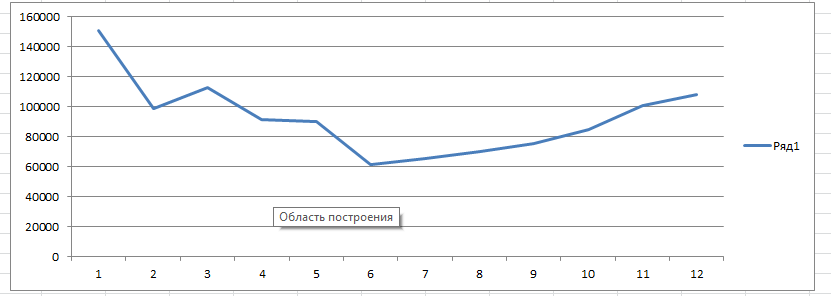
Graph of total frequency
Next, we perform calculations that show how positive or negative the trend of queries is.
- The difference between the first and the last month will show whether there is a drop in the trend.
Frequency difference between the first and the last month
2. the ratio of the second half of the year to the first will show whether the requests are growing or falling. And whether there are growth dynamics.
Calculating the ratio between half-years
3. The column “Is MIN growing” shows what is the growth dynamics for the last 2 months compared to the minimum demand for the whole year
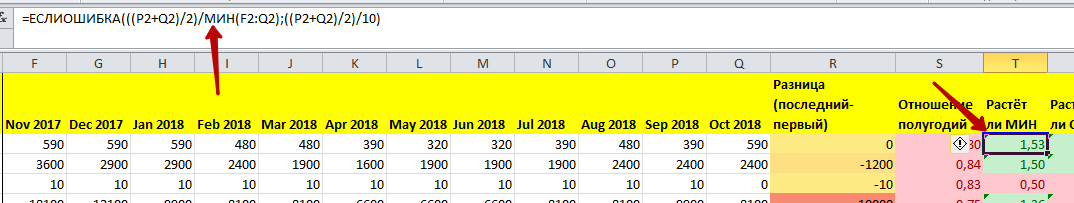
Calculation of frequency growth
4. The column “Is SRED growing” shows what the growth dynamics for the last 2 months is compared to the average demand for the whole year
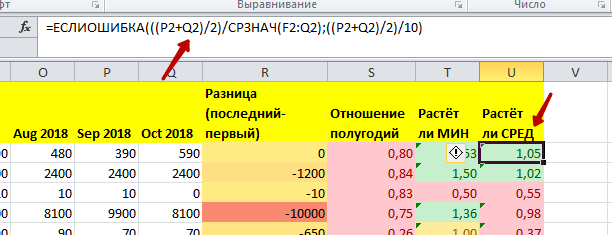
Calculation of the dynamics for 2 months compared to a year
If the coefficient in the column “Is SRED growing” is greater than “1”, then this query can be considered as growing. So, we have analyzed the niche with one more tool.
Google Trends
The last one left, the most inaccurate and not reliable, but requiring attention – Google Trends – https://trends.google.com/trends/explore.
Type in the query iphone x and see the trend line.
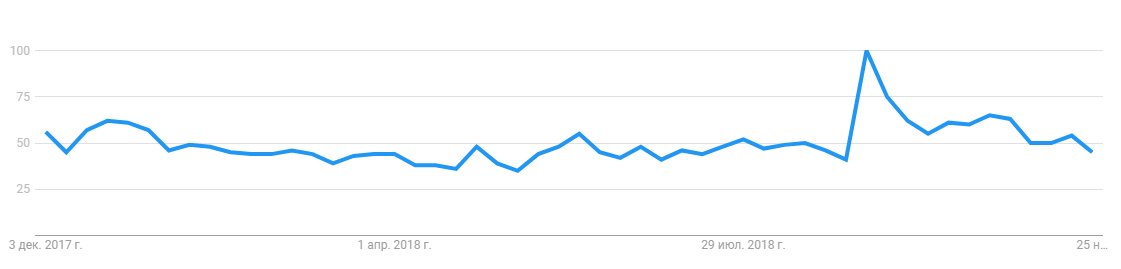
Google Trends graph for the query
At the moment the trending of the query is below 50 units and falling further. There is a list of similar phrases below that you can open and check too. For example, iphone xs:
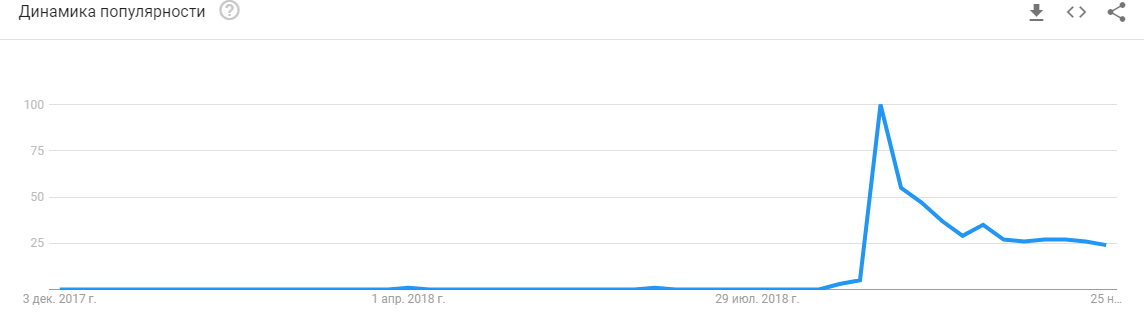
Trending on demand iphone xs
You can download the data from the table, format it properly and plot this graph in excel.
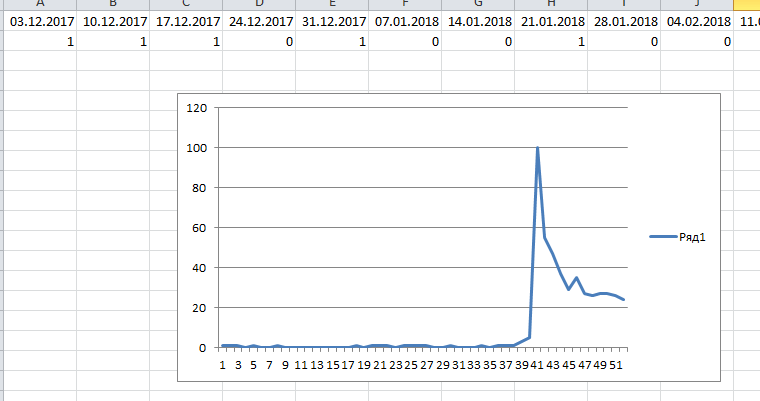
Trend graph in Excel
After we uploaded and analyzed the queries with the help of 3 services, we found out that the trend of iPhones 10 in Ukraine is gradually losing ground.
Calculation of expenses on channels for attracting traffic
Analyzing advertising costs
Since we have already collected semantics, we can analyze the approximate budgets and approximate return on advertising at this stage. This will give us an understanding of how much we need to roughly invest in context to get this or that result.
Contextual advertising is a type of advertising where you pay for each transition to the site to the advertising service. That is, you run out of money in your account – you run out of transitions.
Depending on the location of advertising it can be divided into several types: search and media. But the basic essence of it is the same.
Advertising forecast in Google Ads
We open the Google Ads page and open the functionality of calculating forecast data for contextual advertising. Here you need to select “Keyword Planner”, then select “See the number of queries and forecasts”.
Once you have added the keys, you have the opportunity to vary the price of a click and at the same time receive forecasts for transitions and total budget.
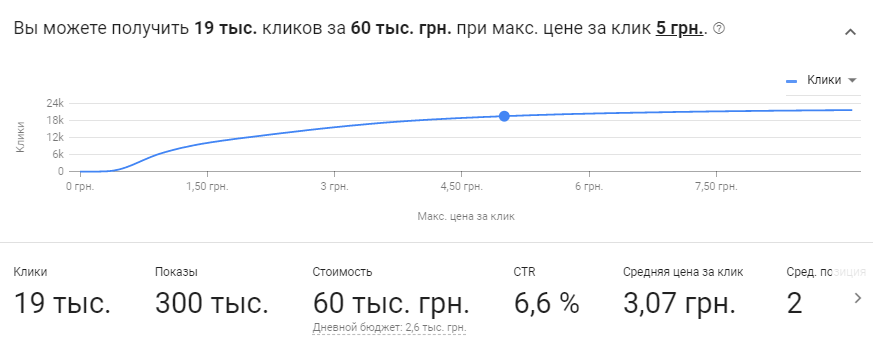
Google Ads Forecast
If necessary, you can download all queries and view them individually.
Data export
That is, based on this forecast, the average price of a click – 3.07 UAH. If you take into account the cost of a click and the conversion rate of the site – the cost of the application 307 UAH.
Setting up contextual advertising Google starts from – 10000 UAH and depending on the amount of work and sources of advertising (Search/KMS/Remarketing/Gmail), will increase.
SEO promotion
If you are going to work with this niche for a long time and expand the list of products/services, then attracting search traffic should definitely be present as one of the channels to attract customers. If your site is new, SEO will not give results at once, you need at least a few months, this is due to the “distrust” of search engines to the site. Google has an unspoken filter – sandbox. If you have an old site and was not under sanctions, then with the right work the first results will appear for 1-2 months of work, perhaps even earlier.
So, the minimum cost of SEO promotion turnkey – with a programmer, copywriter, links, etc. can vary from 15000 to 30000 UAH and more per month, depending on the amount of work, the status of the company, the promotion of the brand SEO-studio.
That is, you need to be mentally prepared for the fact that the first months of work on SEO, you need to invest without getting a return. Search engine promotion – it is like a huge and heavy locomotive, which is a long time to accelerate, but it is very hard to stop it. And even after turning off the engine, it is still very long rolling. But then all the costs are fully compensated by the profit from sales, even after the termination of work on SEO. With proper promotion (white) results will last for more than 1 month.
So, on average you need about 20000 UAH on SEO. And with the expectation that fully pay for itself it will begin to pay off from 3-4 months.
That is, if the average cost of SEO until the payback period of 3-4 months, then the SEO needs about 60-80 thousand UAH. If the site is small, then the costs can be reduced.
Development of the site
The source of sales of your product or service is also very important. Most often only 2 sources are used:
- Website
- Group in a social network
The data given in this paragraph may not be reliable. Since each agency determines independently the cost of this or that work on the development of the site or group. In this article we will not consider the development of a group for sales and its promotion, because for some products and services group in social networks may not be effective. We will consider only the development of a website.
So, if you have only 1 product, and everything else is just its modifications, then the development of a large online store may not be necessary for you. It is enough to create a one-page site, but it is not suitable for SEO promotion. When you have a lot of goods and they are different categories, then it is definitely necessary to create a full-fledged IM.
Immediately we want to give a recommendation – if you are going to create a site for SEO-promotion, it is better not to save on SEO-specialist and functionality. Implementation of most of the functionality costs 30% cheaper if you introduce it immediately during development, rather than re-sawing the working site.
Competitor Analysis
Another detail that you need to think about before starting a business is competitor analysis.
You need to understand – whether you can withstand the market competition with them. Do you have advantages to tilt the buyer’s choice to your side. After all, just a lot of advertising and a lot of traffic from search, by themselves, will not give sales – you must be better than your competitors. Your disadvantages should be less than the disadvantages of competitors and vice versa, your advantages should be more significant than those of competitors.
For example, the competitor has free shipping, and you will offer a discount card for 200 UAH, it will completely cover the free shipping, etc. Each of your shortcomings in comparison with competitors should be closed by some significant plus (advantage). Or you must have a promoted brand that inspires confidence in your store.
So, gather all the criteria in your niche that your customer could look at when choosing an affiliate. Put them in a table, each on a new line, and from the top, take 3 to 10 top competitors and write down everything the competitor offers according to these parameters.
After that, select all the top benefits and apply them to yourself – do you have them. If not, then mark it and think of an advantage that closes this objection.
For example, for a niche selling iPhones. Let’s pick the selection criteria:
- Originality
- Speed of delivery
- Cost of delivery
- Official warranty
- Price
- Exchange/Return
- Trade-in
- Availability of installments
- Post-warranty service
- Product insurance
Fill in the table with your own data and your competitor’s data, analyze the best offers and identify discrepancies. Think about how you can close the difference between what they offer and what you offer.
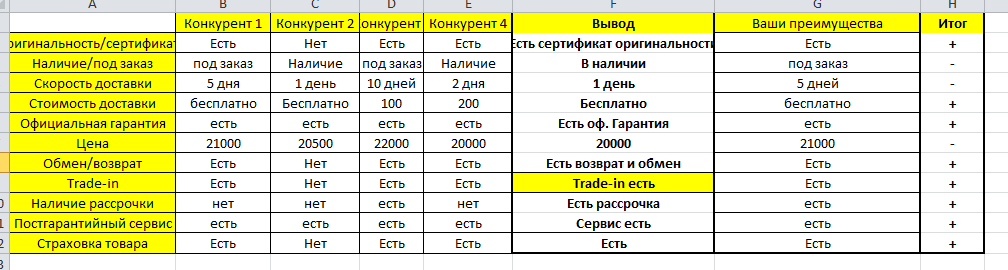
Competitor Analysis Table
Also a similar table or list we would suggest to use for chips on the website. For example:
- A competitor has promotional items when you buy this one;
- There are timers for a discount on a quick purchase;
- There are promotions for buying this product; etc.;
- There are reviews;
- There are social networks, etc.
Consider this table does not make much sense, this work should be carried out by a specialist marketer or seo-shnik. They will know exactly how much this or that block is important or vice versa is not important.
You can simply write out what you like or not on the sites of competitors and offer to implement on your site.
Cost calculation
So, having all the digital data we can calculate the cost of launching your project on the Internet (now we do not mean the launch of your business as a whole, because you can not say how much money you need to buy goods, prepare documents, etc.), we mean the launch of a marketing campaign on the Internet.
Branding and naming can also be included. If you have ideas about the further development of your business and the budget is not very limited, it is worth using this service. If it is a short-term business, then perhaps it will be unnecessary and not pay off the investment. We will not include it in the mandatory service.
Setting up contextual advertising Google – a minimum of 10000 UAH
Оne time SEO-promotion of the site – from 15000 UAH per month
We will take the minimum terms and minimum prices for services. But we want to clarify once again that these prices are not final and depending on the agencies and the quality of work performed can vary sometimes dozens of times both up and down. But still let’s summarize. The minimum that you will need to develop a site, advertising and search engine promotion – about 115000 UAH.
To summarize
Bottom line. We have calculated how much minimum money is needed to launch and maintain the constant growth of your business just on the Internet. But when choosing a niche for a website and starting a business, there are subjective and objective arguments.
Objective arguments are financial issues – this is something that can be calculated and expressed in figures – it is essentially all that is mentioned above plus the cost of opening the business itself: staff, purchases, premises, the cost of opening a company, etc.
Subjective arguments, in our opinion, are a comparison with competitors and your potential advantages, inner gut (so-called entrepreneurial spirit) – this is something that can not be calculated financially.
Only after correctly and logically weighing all subjective and objective arguments, make a decision about starting a business.

commercial offer
Other articles by the author

17/07/2025
For businesses, a targetologist is a strategic partner in growing sales and building brand awareness.

18/09/2025
KPIs serve as a strategic tool for measuring results and improving business efficiency.

27/12/2024
The Internet is currently changing very rapidly due to the development of artificial intelligence. Google is leading the way in this process. Its new AI Overviews feature demonstrates how technology is making information easier to access. How exactly does it work and why is it so important for users and content creators?
Latest articles by #PPC

27/05/2026
For businesses, this isn't just a technical detail it's the foundation for SEO, content, website structure, and launching advertising campaigns.

21/05/2026
A relevant page is a page that most accurately matches the intent of the person who entered the query.

08/05/2026
For local businesses, a Google profile is often the first point of contact, even before a visit to the website or a phone call.