

 17/11/2026
 824

Інтернет-маркетинг
простою мовою
Content of the article
- /01 What is goal decomposition in marketing and sales?
- /02 Defining goals and key metrics
- /03 How to break down a goal through the marketing funnel
- /04 How to calculate the required number of leads and conversions
- /05 How to calculate the required traffic and marketing budget
- /06 How to turn calculations into a real action plan

Decomposing goals in marketing and sales: how to calculate required leads and conversions

When a business sets ambitious goals for the year or quarter, the usual approach of «just selling more» stops working. Simply setting a target revenue figure or projected income creates the illusion of control, but offers no guarantees or insight into whether this result is achievable under current market conditions. To assess the realism of these plans, it’s not enough to rely solely on financial expectations. It’s essential to clearly understand exactly how many potential customers need to be attracted in the upper stages of the sales funnel, what conversion rates the marketing and sales departments must achieve, and what resources will be needed to accomplish these tasks. The success of a business unit always depends on the close connection between the company’s strategic ambitions, the effectiveness of marketing activities, and the operational performance of the sales department.
In this article, we’ll explore how to break down goals in marketing and sales, calculate the required number of leads and conversions, and use these metrics for budget planning and performance tracking.
What is goal decomposition in marketing and sales?
Goal decomposition is a management technique that involves systematically breaking down a large-scale, overarching goal into smaller, specific, measurable, and controllable subtasks, the collective completion of which guarantees the achievement of the planned result.
In the context of marketing and sales, this approach takes on particular practical value. A major business goal such as increasing annual revenue by 50% or attracting a thousand new customers cannot be a direct task for a digital marketer or sales manager.
The decomposition methodology allows you to transform an abstract financial goal into a clear hierarchy of metrics: the required number of closed deals, the number of qualified inquiries, initial leads, targeted actions on the website, and the volume of advertising traffic. For a modern enterprise, implementing this approach is critically important for several reasons.

It’s important to understand that decomposition alone does not guarantee that the plan will be fulfilled. It serves as a roadmap: it helps identify patterns among business metrics, verify assumptions against actual data, and promptly identify deviations between actual and projected results.
Defining goals and key metrics
Any calculation begins with defining the ultimate goal, the time horizon, and the initial parameters. In business planning, two types of goal formulation are most commonly used:
- quantitative, such as attracting 30 new customers within a month;
- financial, such as generating 1,200,000 UAH in revenue during the reporting period.
If a company works with a financial goal, it must be converted into a physical sales figure. To do this, the planned average check amount or average revenue per successful transaction is used.
The basic formula for converting a financial goal into sales is as follows:

Let’s look at an example to illustrate this.
A company sets a goal of generating 1,200,000 UAH in revenue for a calendar month. Based on historical data, the average value of a single successful transaction that is, the average check is 40,000 UAH. Let’s perform the calculation:
1,200,000 UAH / 40,000 UAH = 30 sales
These 30 sales serve as a planning benchmark, assuming the current average check remains constant.
However, in real-world planning, one cannot limit oneself to just a single figure. It is necessary to account for seasonal fluctuations in the average check, the potential for cross-sales, the percentage of cancellations or returns, as well as the difference between gross revenue and gross profit.
The goal must meet the criteria of specificity, measurability, attainability, realism, and time-boundness (the SMART concept). At the outset, it is important to collect historical data for previous periods:
- conversion rates between funnel stages;
- total number of leads;
- acquisition cost;
- deal cycle duration.
If the business is new or is launching a fundamentally new product, targets are set based on sound market assumptions, which are then adjusted based on the results of the first few weeks of operation.
How to break down a goal through the marketing funnel
Once the required number of final sales has been determined, the backward calculation principle is applied. The logic is to work backward from the final event that is, the sale to the user’s very first contact with the brand, sequentially determining the volume of potential customers at each intermediate stage.
The structure of the funnel depends directly on the company’s business model. For an online store or a simple service, the customer journey may be short: website visit — inquiry — sale. For a complex B2B segment or services with a long decision-making cycle, the funnel branches out significantly: inbound lead — qualified lead — initial online meeting — product demonstration — commercial proposal — closing the deal.
To perform calculations correctly, it is necessary to clearly distinguish between the basic concepts of the sales funnel, which are often mistakenly conflated.
A lead is a potential customer who has provided their contact information, filled out a form, or otherwise expressed initial interest in the product according to the company’s criteria.
A qualified lead is a potential customer who has been verified as matching the target audience profile and has a genuine need and budget. In B2B practice, the following are often distinguished:
- MQL (Marketing Qualified Lead a lead prepared by the marketing department);
- SQL (Sales Qualified Lead a lead confirmed by the sales department).
The business sets its own qualification criteria.
Conversion is the ratio of the number of users who have successfully moved to the next stage of the funnel to the total number of participants in the previous stage, expressed as a percentage.
A sale is the confirmed fact of payment or the signing of a contract, which signifies the completion of the sales cycle.
The basic formula for calculating the conversion rate between any adjacent stages is as follows:
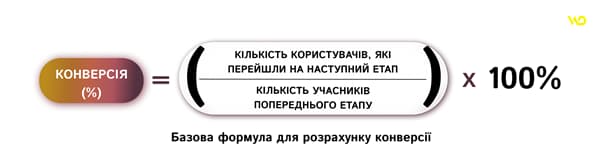
If 20 users out of 100 initial leads reach the purchase stage, the conversion rate is 20%.
Calculations are always based on comparable data from the same period and for a single audience. It is unacceptable to mix metrics from different advertising campaigns or different months without accounting for changes in conditions.
How to calculate the required number of leads and conversions
To better understand the logic behind the reverse calculation, let’s consider a company with the following parameters:
- targeted monthly revenue — 1,200,000 UAH;
- average revenue per successful deal — 40,000 UAH;
- Required number of sales — 30 (calculated in the previous sections);
- conversion rate from lead to qualified lead — 40%;
- conversion rate of a qualified lead to a meeting — 50%;
- Meeting-to-sale conversion rate — 25%.
Let’s break down the step-by-step reverse calculation of the sales funnel in this case.
Step 1. Determining the number of required sales
1,200,000 UAH / 40,000 UAH = 30 sales.
Step 2. Calculate the required number of meetings
Since 25% of meetings result in a successful deal, to achieve 30 sales, you need to schedule:
30 / 0.25 = 120 meetings.
Step 3. Calculating the required number of qualified leads
Given that 50% of qualified leads reach the meeting stage, we calculate the total number needed:
120 / 0.50 = 240 qualified leads.
Step 4. Calculating the required number of initial leads
If 40% of all new inquiries meet the qualification criteria, the total volume of the initial lead flow should be:
240 / 0.40 = 600 leads.
Let’s summarize all this data in a table for convenience.
| Funnel stage | Conversion rate to the next stage | Required number of leads |
|---|---|---|
| Initial leads | 40% qualify | 600 |
| Qualified leads | 50% schedule a meeting | 240 |
| Meetings / negotiations | 25% result in a deal | 120 |
| Sales | Ultimate business goal | 30 |
In this funnel, the number of meetings is an intermediate stage between qualified leads and sales, and each conversion reflects the transition from the previous stage to the next. The general formula for calculating the top stage by multiplying all intermediate conversions is as follows:

Let’s plug in our values:
30 / (0.40 × 0.50 × 0.25) = 30 / 0.05 = 600 leads.
If the calculations result in fractional numbers for example, if the required number of applications or meetings is 123.4 it is standard practice to round them up to the nearest whole number to ensure the minimum target is met without the risk of a shortage of leads.
How to account for conversion rate fluctuations during planning
When breaking down the plan, it’s important to calculate not only the base scenario but also alternative scenarios in case metrics deteriorate. For example, if the conversion rate from meetings to sales drops from 25% to 20%, closing 30 deals will require 150 meetings instead of 120. Assuming conversion rates remain unchanged in the earlier stages, this would mean a need for 300 qualified leads and 750 initial leads instead of 240 and 600, respectively. This calculation helps estimate in advance the additional need for traffic, budget, and team resources.
For a baseline forecast, it’s advisable to use actual data from previous periods, and for a conservative scenario, factor in a potential drop in conversion rates especially if the business is targeting a new audience or switching advertising channels.
How to calculate the required traffic and marketing budget
The breakdown doesn’t stop at the initial lead generation stage. For marketing to generate 600 leads, you need to calculate the volume of the upper funnel the number of website visitors or ad clicks.
We use the traffic-to-leads conversion formula:

Let’s continue with the example we calculated earlier. Let’s assume that the average conversion rate (CR) of the corporate website to a target lead is 3%. Let’s do the math:
600 leads / 0.03 = 20,000 visits.
This means that to generate 600 leads at the website’s current conversion rate of 3%, the marketing team needs to attract 20,000 targeted visitors to the website. This is a mathematical projection that holds true provided the platform’s conversion metrics remain stable.
The next critical step is evaluating the marketing budget. If a company has reliable historical data or results from test advertising campaigns regarding the cost per lead (CPL), it can calculate approximate expenses:

Let’s assume a CPL of 750 UAH:
600 leads × 750 UAH = 450,000 UAH.
The resulting amount of 450,000 UAH is a preliminary estimate of the direct costs of generating the required volume of leads through advertising channels. It is important to understand that this figure primarily covers the advertising budget and may not include expenses for the team’s salaries, creative development, software, or analytics. In addition, based on the projected traffic volumes and budget, management must verify the business’s technical and operational capacity: whether the server can handle the current load, whether the sales department has sufficient resources to process 600 leads per month, and whether the calculated cost of acquisition aligns with the product’s economic profitability.
How to turn calculations into a real action plan
Any mathematical decomposition model remains just a table of numbers until it is integrated into the company’s daily business processes.
Let’s look at the step-by-step process for doing this.

The first step is to have all key stakeholders the business leader, the marketing director, and the sales manager approve a coordinated plan. All participants must not only review the numbers but also confirm that they are achievable within the constraints of available resources. Next, assign personal responsibility for each metric:
- who specifically prepares the creative assets;
- who sets up the ads;
- who conducts the initial qualification;
- who is responsible for closing the deal.
It’s important to establish clear timeframes and procedures for regular monitoring. Weekly comparisons of actual metrics against targets allow you to identify minor deviations in a timely manner and make corrective decisions such as changing ad copy, reallocating the budget across channels, or adjusting sales scripts. Decomposition does not completely eliminate market uncertainty, but it radically changes the nature of management; instead of «putting out fires» at the end of the month, the company receives clear indicators of the business’s status at every stage of the funnel.
A business plan becomes truly manageable and predictable only when the management team understands not just the desired profit figure at the end of the reporting period, but every element in the chain leading to that figure: workload, conversion rates, and precise checkpoints for timely responses.

commercial offer
Other articles by the author

02/03/2026
Customer Development (CustDev or “castdev”) is an approach to product development that focuses on testing business hypotheses through direct communication with potential customers.

18/06/2026
A marketing director is, first and foremost, a top manager who is part of a company’s senior leadership and thinks in terms of the business as a whole, rather than individual advertising campaigns.

16/09/2026
Choosing between search engine optimization and pay-per-click advertising is one of the most critical decisions when developing a marketing strategy.
Latest articles by #Useful tips

02/10/2026
For businesses, CPL is the primary metric for measuring how effectively ads and landing pages convert cold traffic into initial leads.

24/09/2026
While feeds were previously viewed as a purely technical feature for running contextual ads in Google Ads, today their quality directly determines the share of impressions across all sales channels.
16/09/2026
Choosing between search engine optimization and pay-per-click advertising is one of the most critical decisions when developing a marketing strategy.