

 26/08/2026
  1237
1237

Інтернет-маркетинг
простою мовою
Content of the article
- /01 How to set up TikTok analytics
- /02 Account analytics overview
- /03 Why analyze individual videos?
- /04 How to analyze your TikTok audience profile
- /05 Live stream statistics
- /06 Messaging statistics
- /07 Measuring the engagement rate
- /08 The importance of competitor analysis
- /09 Third-party analytics services
- /10 How to improve social media metrics
How to view statistics on TikTok: a guide for bloggers and businesses

TikTok has long since ceased to be merely an entertainment platform and has evolved into an effective channel for promotion, lead generation, and building brand relevance. However, creating content intuitively without relying on data often leads to wasted advertising budgets and lost time.
In this guide, we’ll take a detailed look at how to enable and correctly interpret TikTok analytics, which metrics are crucial for evaluating the effectiveness of your marketing efforts, and how to use the data you gather to refine your content strategy and grow your business.
How to set up TikTok analytics
To access TikTok advanced analytics system, you need to switch your profile to a business account. By default, basic personal accounts provide limited information, which doesn’t allow you to fully evaluate the effectiveness of your marketing efforts. Switching to a business account is free and takes just a few minutes.
To activate the analytics tools, follow these steps:
- Go to your profile by clicking the icon in the lower-right corner of the screen;
- Open the side menu by tapping the three horizontal lines in the top-right corner;
- go to the «Settings & Privacy» or «Business Tools» section;
- Select «Change Account Type» and switch to «Business Account»;
- Select the category that most accurately reflects your company’s line of business or content focus.
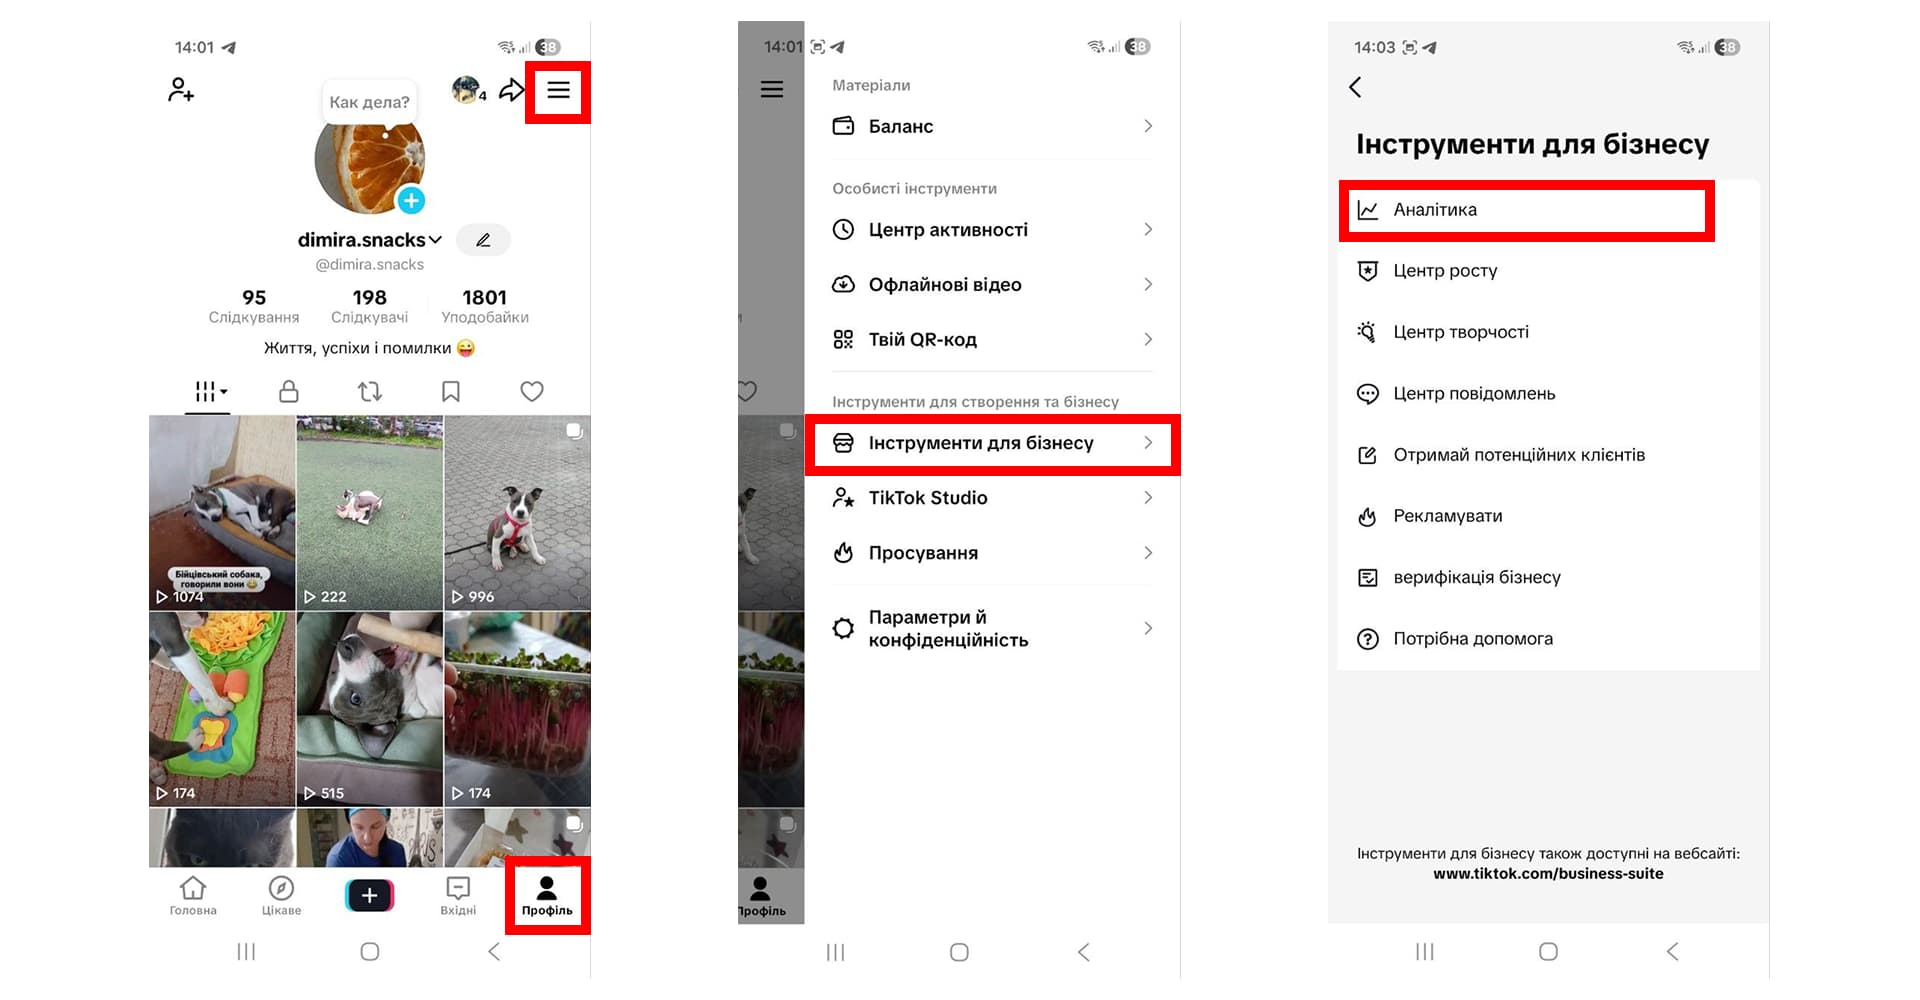
After completing these steps, a full-fledged «Analytics» section will appear in your menu. Data begins to be collected as soon as you switch to a Business Account, so it’s best to evaluate your initial results a few days after posting new videos.
Switching to a Business Profile is the foundation for making any strategic decisions, as it provides access to systematic monitoring of key metrics directly within the mobile app or the platform’s web version.
Account analytics overview
The «Overview» section provides a general picture of your profile’s status over a selected time period. The platform allows you to analyze data for the last 7 days, 4, 8, or 12 weeks, as well as 12 months. This enables you to track both short-term dynamics following the launch of individual campaigns and overall brand growth trends.
This section compiles metrics that demonstrate the scale of your presence on the platform:
- Reach: total video views, unique audience reach, and profile views;
- Engagement: likes, comments, and shares of your videos by users;
- Conversions: target actions influenced by your content (e.g., link clicks, etc.).
Evaluating these metrics together allows you to understand the overall direction of your account’s growth and analyze each stage of customer interaction.
For example, if reach metrics (video views) are growing rapidly but engagement and conversions remain low, this indicates that the content successfully grabs attention in the feed, yet the offer or profile header does not inspire users to learn more about the product. This in-depth analysis of macro metrics allows you to fine-tune the marketing funnel and promptly remove barriers along the customer’s path to purchase.
Why analyze individual videos?
To understand why one video goes viral while another doesn’t even reach a thousand views, you need to move on to a detailed analysis of specific posts. You can view a video’s statistics directly from the video itself by tapping the three dots in the lower-right corner and selecting the «Analytics» tab, or by going to the «Video» section in Business Tools and selecting the «Analytics» tab.
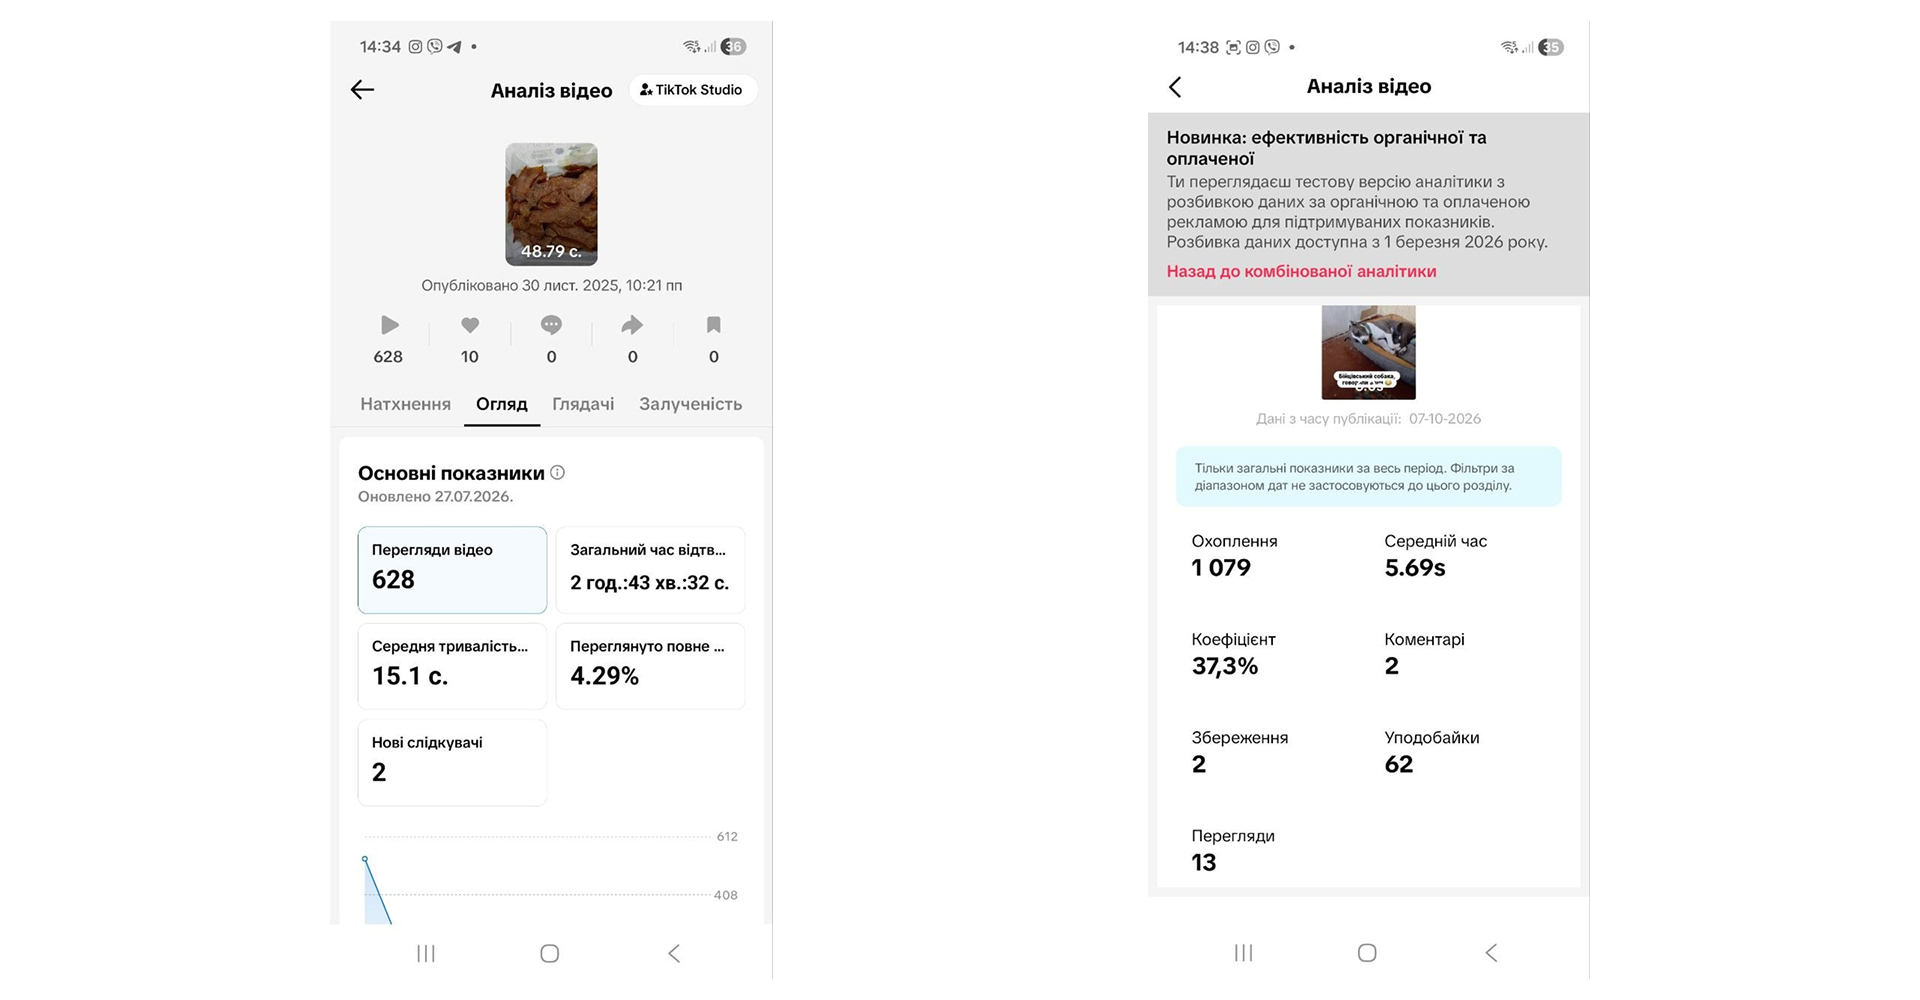
When analyzing a specific video, pay special attention to the following metrics:
- average watch time: the average number of seconds a viewer spends watching the video;
- retention rate: the percentage of users who watched the video until the very end;
- traffic sources: where viewers came from («For You» feed, search, personal profile, sounds, or hashtags);
- conversion to followers: how many people followed the profile immediately after watching this video.
Retention is the most critical metric for TikTok algorithms. If viewers close the video within the first 2–3 seconds, the platform stops showing it to new users. By analyzing traffic sources, you can assess whether your content is appearing in global recommendations or if views are coming solely from your existing follower base.
An in-depth analysis of each video allows you to identify the most successful storylines and visual triggers, which you can later scale up in future content plans.
How to analyze your TikTok audience profile
Understanding exactly who is viewing your content allows you to create targeted offers and tailor your approach to the needs of potential customers. The «Audience» tab provides a detailed demographic and behavioral breakdown of users who interact with your profile.
When analyzing your audience, it’s important to distinguish between two key concepts: reach (all users who have seen your videos) and engagement (those who have interacted with your content). The following metrics are available for analysis:
|
Follower Activity |
An hourly graph showing when followers are online |
|
Geography |
Top countries and cities where viewers live |
|
Gender and age |
Percentage breakdown of the audience by demographic groups |
This data has practical value for businesses. For example, if a company provides services only within Ukraine, but a significant percentage of views comes from other countries, it’s necessary to review the language of the content, the use of local hashtags, and geotagging errors.
Knowing peak activity times allows you to post content precisely when the audience is most engaged, which gives TikTok algorithms an initial boost to further promote the video in recommendations.
Live stream statistics
Live streams on TikTok are an effective tool for building trust, presenting products, answering questions, and making direct sales. For accounts that regularly host live streams, the platform provides a dedicated «Live Streaming Center» with comprehensive analytics.
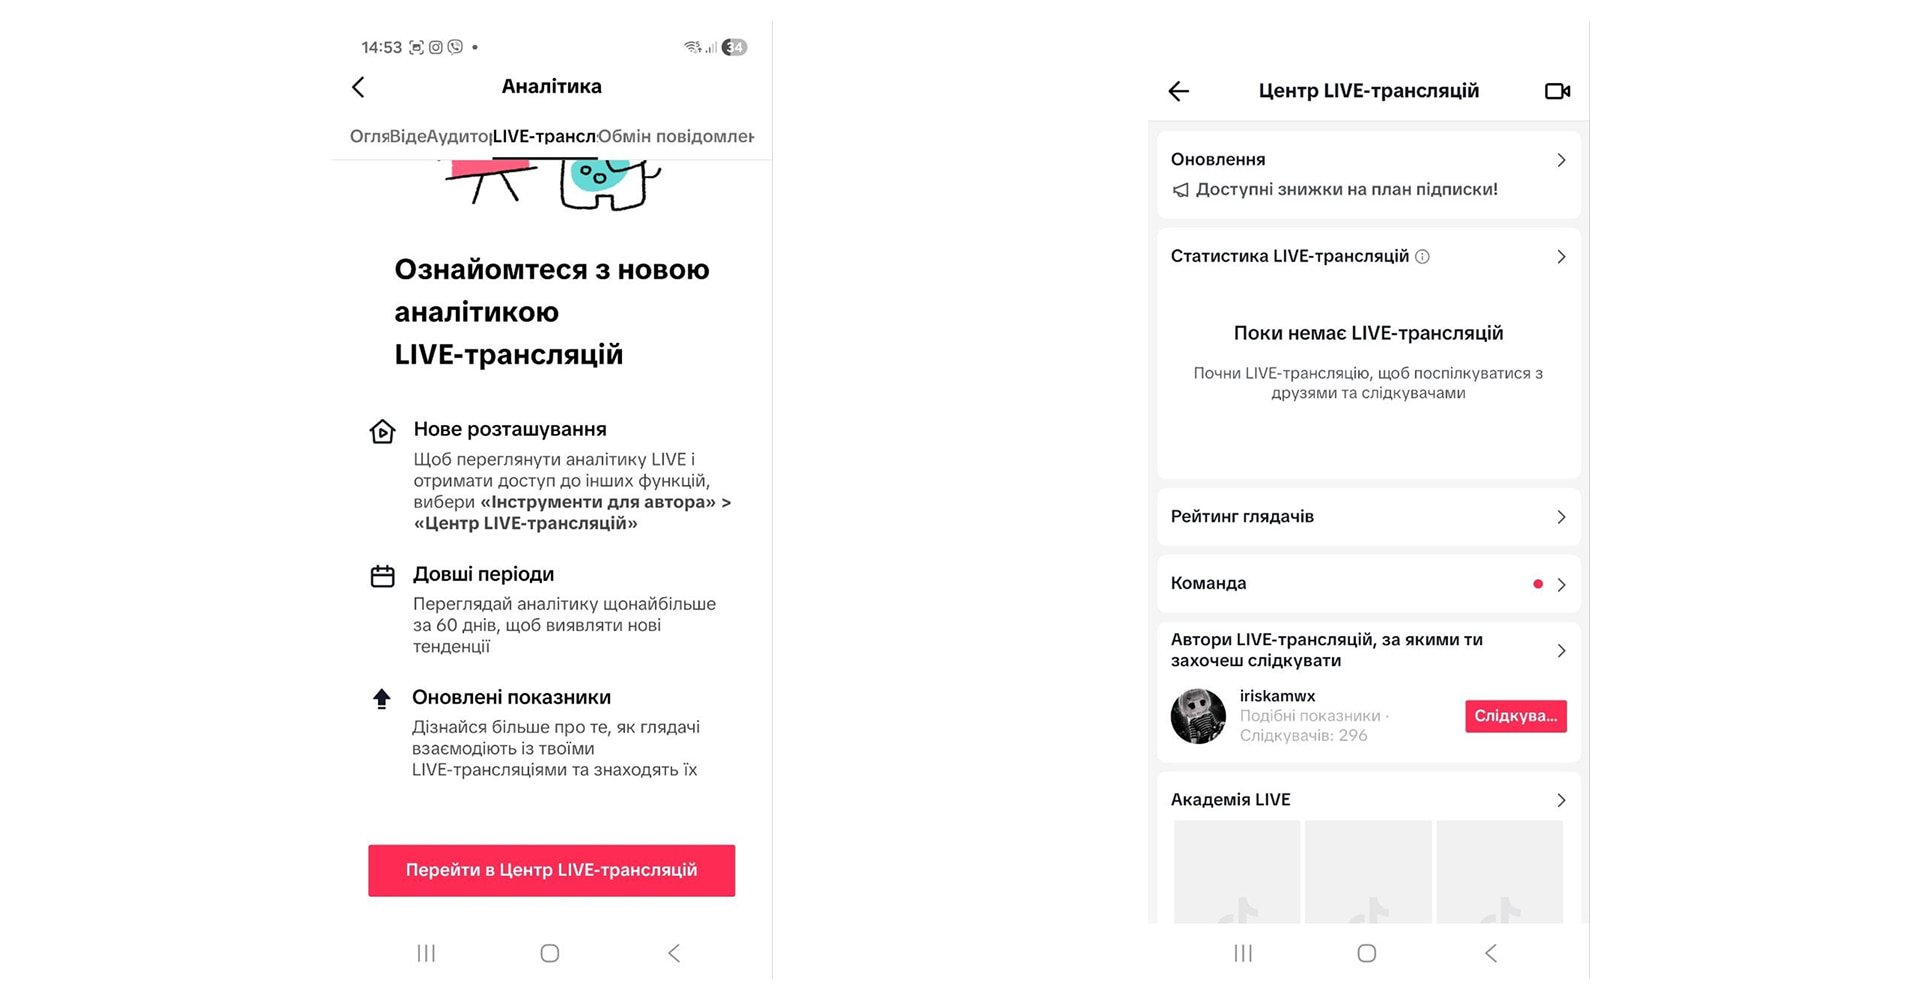
Live stream statistics track the total number of viewers who tuned in to the stream, the peak number of concurrent viewers, new followers gained during the stream, as well as the stream duration and the number of virtual gifts received (if monetization is enabled).
Analyzing stream results allows you to assess audience engagement in real time. By comparing the stream’s duration with the number of new subscribers and peak viewers, you can identify the best topics for discussion and the optimal time to go live.
For commercial accounts, streams are the shortest path from a viewer’s first encounter with the brand to placing an order, and their analytics help improve the scripts for future online events.
Messaging statistics
The «Messaging» tab warrants a separate analysis, as it allows you to assess the quality of a business’s direct communication with potential customers. Unlike the general overview, the analytics in this section let you select specific time intervals: the last 28 days, 7 days, or a detailed breakdown of yesterday’s data. This allows you to both track immediate responses to newly published content and analyze monthly trends in lead conversion.
This section covers the following key areas:
- messaging audience: the volume and characteristics of users who engage in private communication with the brand;
- Feedback: assessment of user reactions in conversations, the company’s response speed, and the quality of communication;
- chats: the number of open conversations, overall messaging intensity, and the trend in new inquiries.
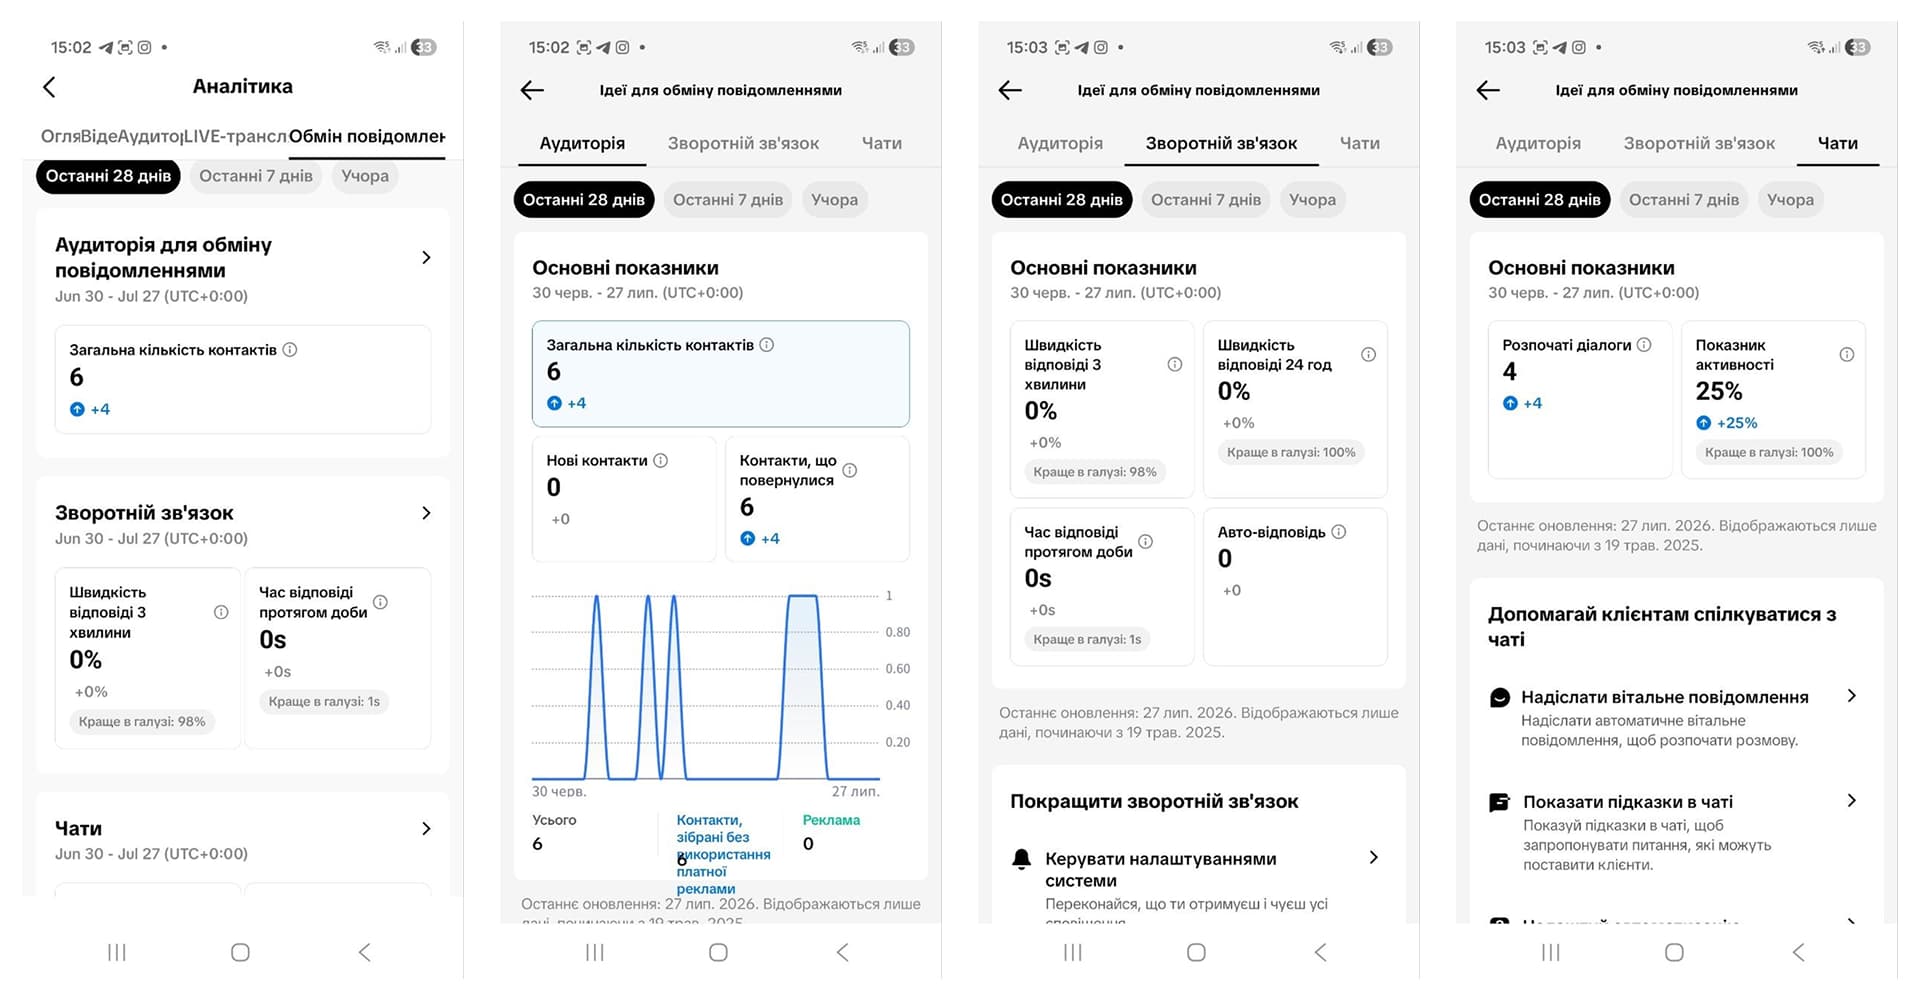
Analyzing this data allows you to monitor the most critical stage of the sales funnel the conversion of an interested viewer into a buyer. The ability to compare yesterday’s metrics with weekly or monthly averages helps you promptly identify delays in processing requests and adjust the workload on managers. Fast and high-quality feedback in chats directly impacts audience loyalty and turns a user’s initial interest into a successful deal.
Measuring the engagement rate
For marketing agencies and businesses, raw view counts aren’t always an indicator of success. The key metric for content quality on TikTok is the engagement rate (ER). It shows what percentage of people who viewed a video decided to interact with it.
Two main formulas are used to calculate the ER on TikTok:
- ER based on views: the sum of all interactions (likes + comments + shares + saves), divided by the total number of views and multiplied by 100%
- ER by followers: the sum of all interactions on the last 10–20 posts, divided by the number of followers and the number of videos analyzed
A good ER based on views for TikTok business accounts typically ranges from 4% to 10%. If this metric drops below 2%, it means that the videos are receiving random reach but are not eliciting an emotional response from the target audience. Systematically calculating ER allows you to weed out ineffective content categories and focus your efforts solely on the formats that generate genuine engagement.
The importance of competitor analysis
TikTok internal analytics show only your own data; however, regular monitoring of competitors’ accounts is necessary for an objective assessment of your market position. Although you cannot access another profile’s analytics dashboard, the platform provides enough public information for effective benchmarking.
When researching similar accounts, pay attention to the following public metrics:
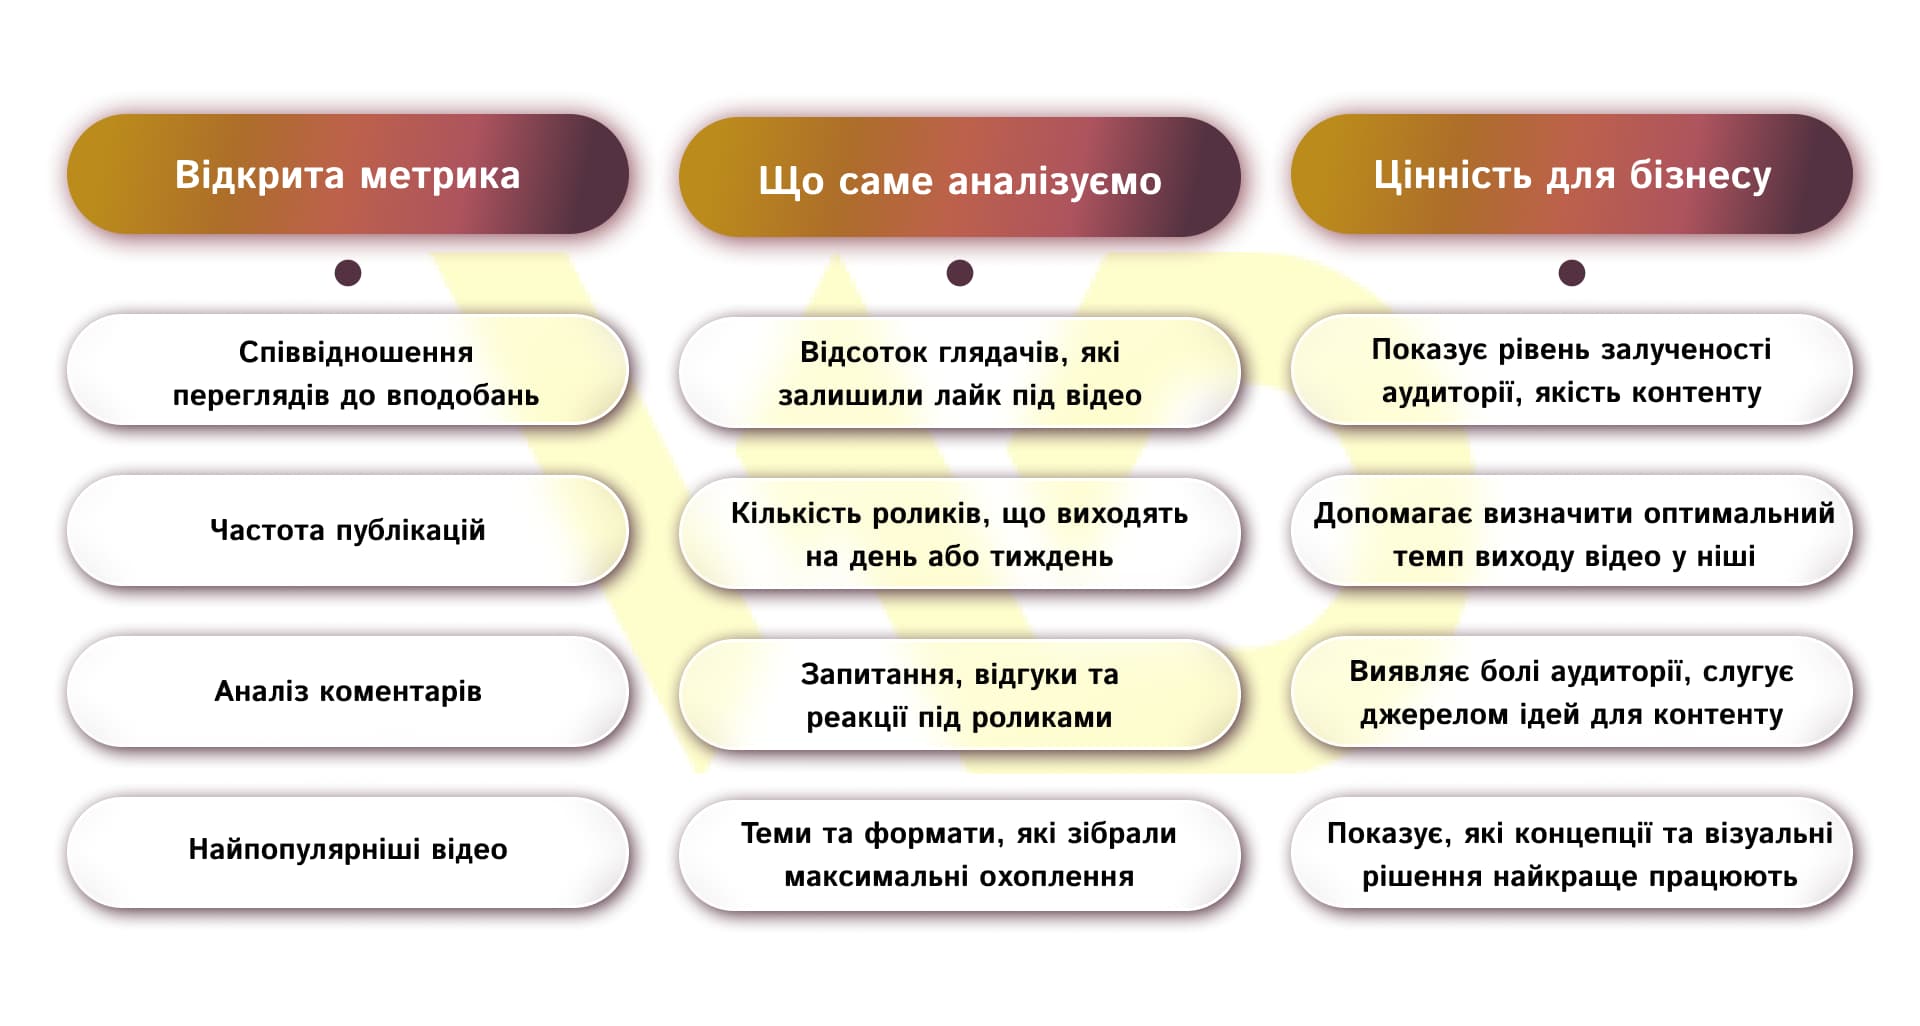
Systematic monitoring of related accounts allows you to spot market trends before they become mainstream and avoid mistakes that other players have already made. This helps you develop a unique value proposition and identify content gaps that competitors haven’t yet filled.
Third-party analytics services
Despite the rich functionality of TikTok built-in analytics, it has its limitations, such as the depth of historical data retention or the inability to automatically export reports in convenient formats. For deeper analytics, building complex reports, and comparing multiple accounts, it’s advisable to use third-party professional services.
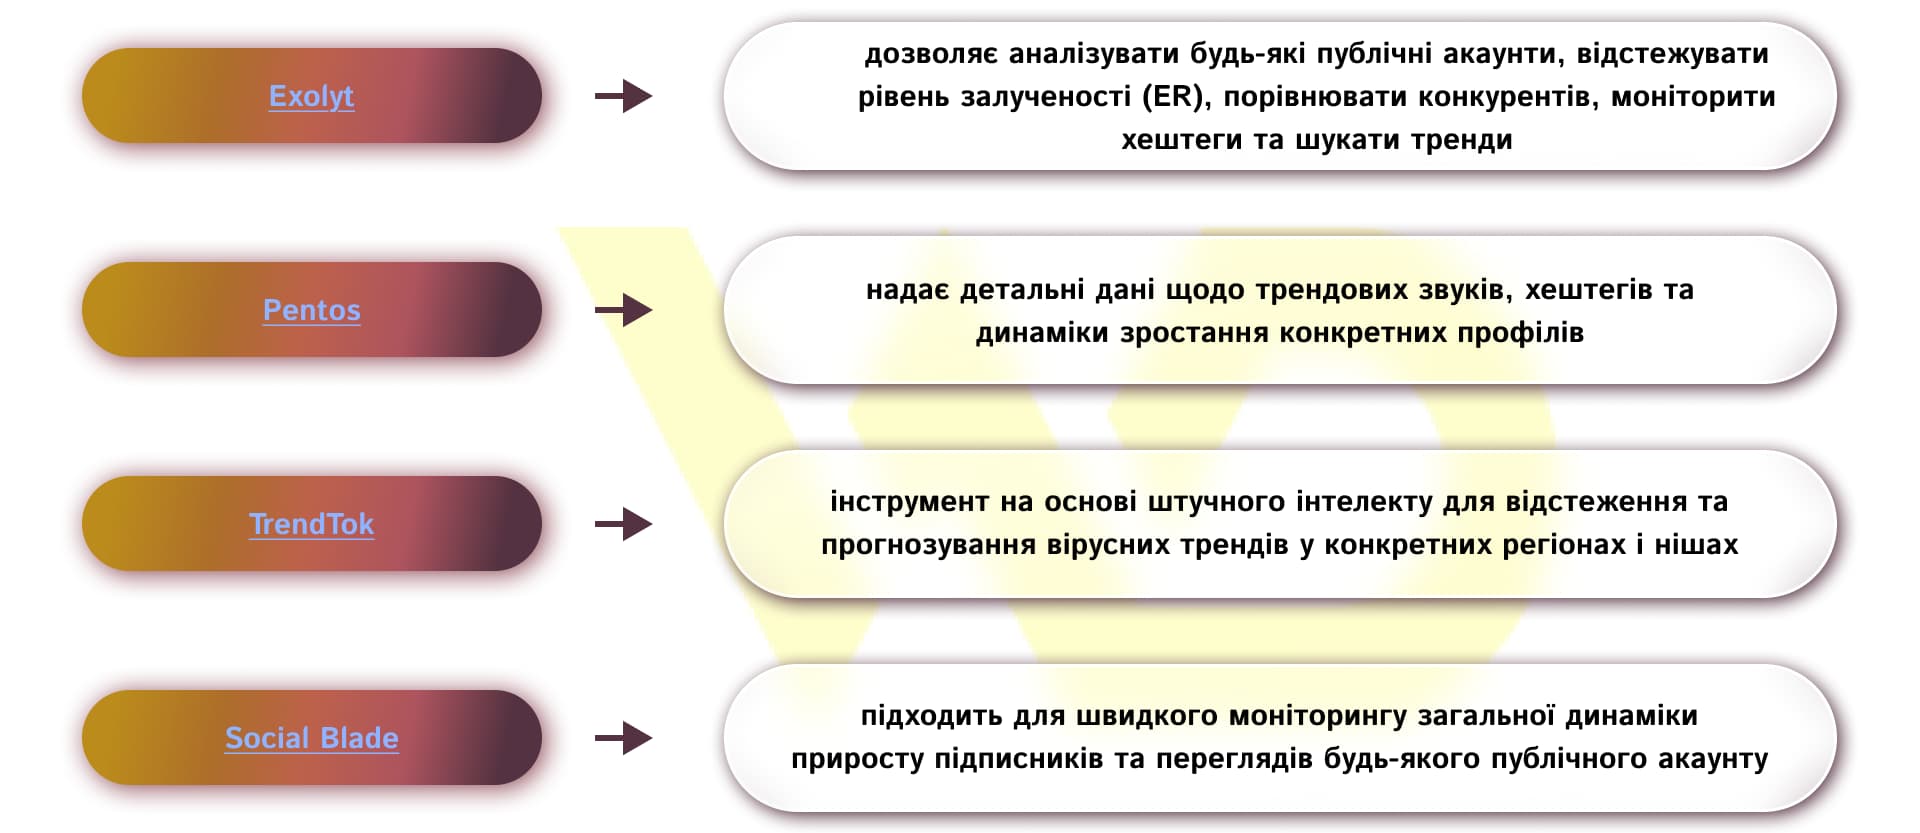
Third-party services save time on manual data collection, allow you to generate visual reports for clients or management, and provide an analytical foundation for adjusting your overall SMM strategy.
How to improve social media metrics
Collecting data is pointless if it doesn’t lead to concrete actions. For analytics to translate into real growth in reach and sales, the data must be incorporated into your daily account management.
Here are a few practical steps to help you optimize your metrics based on your analysis:
- Optimize the first 3 seconds. If the retention rate shows a sharp drop at the beginning of a video, change your approach to the visual and text hooks.
- Use SEO optimization. Include keywords in your video descriptions, captions, and voiceovers. Search traffic on TikTok is becoming an increasingly significant source of consistent views.
- Engage with comments. Answer users’ questions in the form of new videos. This not only boosts engagement but also creates additional content that appeals to an already engaged audience.
- Test new formats based on engagement. If analytics show a high retention rate for informational videos, increase their share in your content plan relative to entertainment videos.
TikTok analytics aren’t just a dry set of numbers they’re live feedback from your potential audience. Regularly analyzing metrics allows you to move beyond assumptions and rely on facts, optimize your content creation process, and turn your account into a reliable tool for business growth.

commercial offer
Other articles by the author

05/02/2026
When a brand tells stories about people, challenges, and solutions, it becomes more understandable and relatable to the customer.

14/08/2026
While most brands focus their budgets on Instagram or Google Ads, Pinterest remains an underrated platform with an audience that has high purchasing power.

02/07/2026
Choosing the wrong ad format is the main reason for a low return on investment (ROI) and the rapid depletion of a company's marketing budget.
Latest articles by #Useful tips

02/10/2026
For businesses, CPL is the primary metric for measuring how effectively ads and landing pages convert cold traffic into initial leads.

24/09/2026
While feeds were previously viewed as a purely technical feature for running contextual ads in Google Ads, today their quality directly determines the share of impressions across all sales channels.
16/09/2026
Choosing between search engine optimization and pay-per-click advertising is one of the most critical decisions when developing a marketing strategy.