

 15/07/2026
  1327
1327

Інтернет-маркетинг
простою мовою
Content of the article

NPS loyalty index: how to assess customer attitudes toward your brand

For a business, it’s not enough to simply attract new customers. It’s also important to understand whether they’re willing to return to the company and recommend it to others. After all, it’s loyal customers who are more likely to make repeat purchases, positively influence the brand’s reputation, and contribute to its organic growth. Therefore, measuring loyalty has become one of the key tools for companies seeking to improve the customer experience and make data-driven decisions. One of the most common metrics for assessing customer sentiment toward a brand is the Net Promoter Score (NPS).
In this article, we’ll explore what NPS means, how to calculate and interpret it correctly, when to conduct surveys, what tools to use to collect responses, and how to turn the results into practical changes that will help increase customer loyalty.
What is NPS
The Net Promoter Score (NPS) is a customer loyalty index that shows how likely people are to recommend a company, product, or service to their friends and family.
This methodology was proposed by Fred Reichheld, a consultant at Bain & Company, in his article «One Number You Need to Grow», published in 2003 in the Harvard Business Review. In it, the author argued that a customer’s willingness to recommend a company is one of the best indicators of future business growth.
The core idea behind NPS is that a customer’s willingness to recommend a brand is one of the best indicators of long-term loyalty. A person may be generally satisfied with a purchase but still not recommend the company to others. That is why NPS measures not just satisfaction levels, but emotional attachment to the brand.
Today, NPS is used by companies in the following sectors:
- e-commerce:
- finance;
- SaaS;
- retail;
- healthcare;
- B2B services.
This metric is popular because it is easy to measure; it allows for quick comparison of results over time; and it correlates with repeat purchases and recommendations.
How the NPS works
Customers are asked one key question: «How likely are you to recommend our company to friends or colleagues?».
The response is rated on a scale from 0 to 10. Respondents are then divided into three groups:
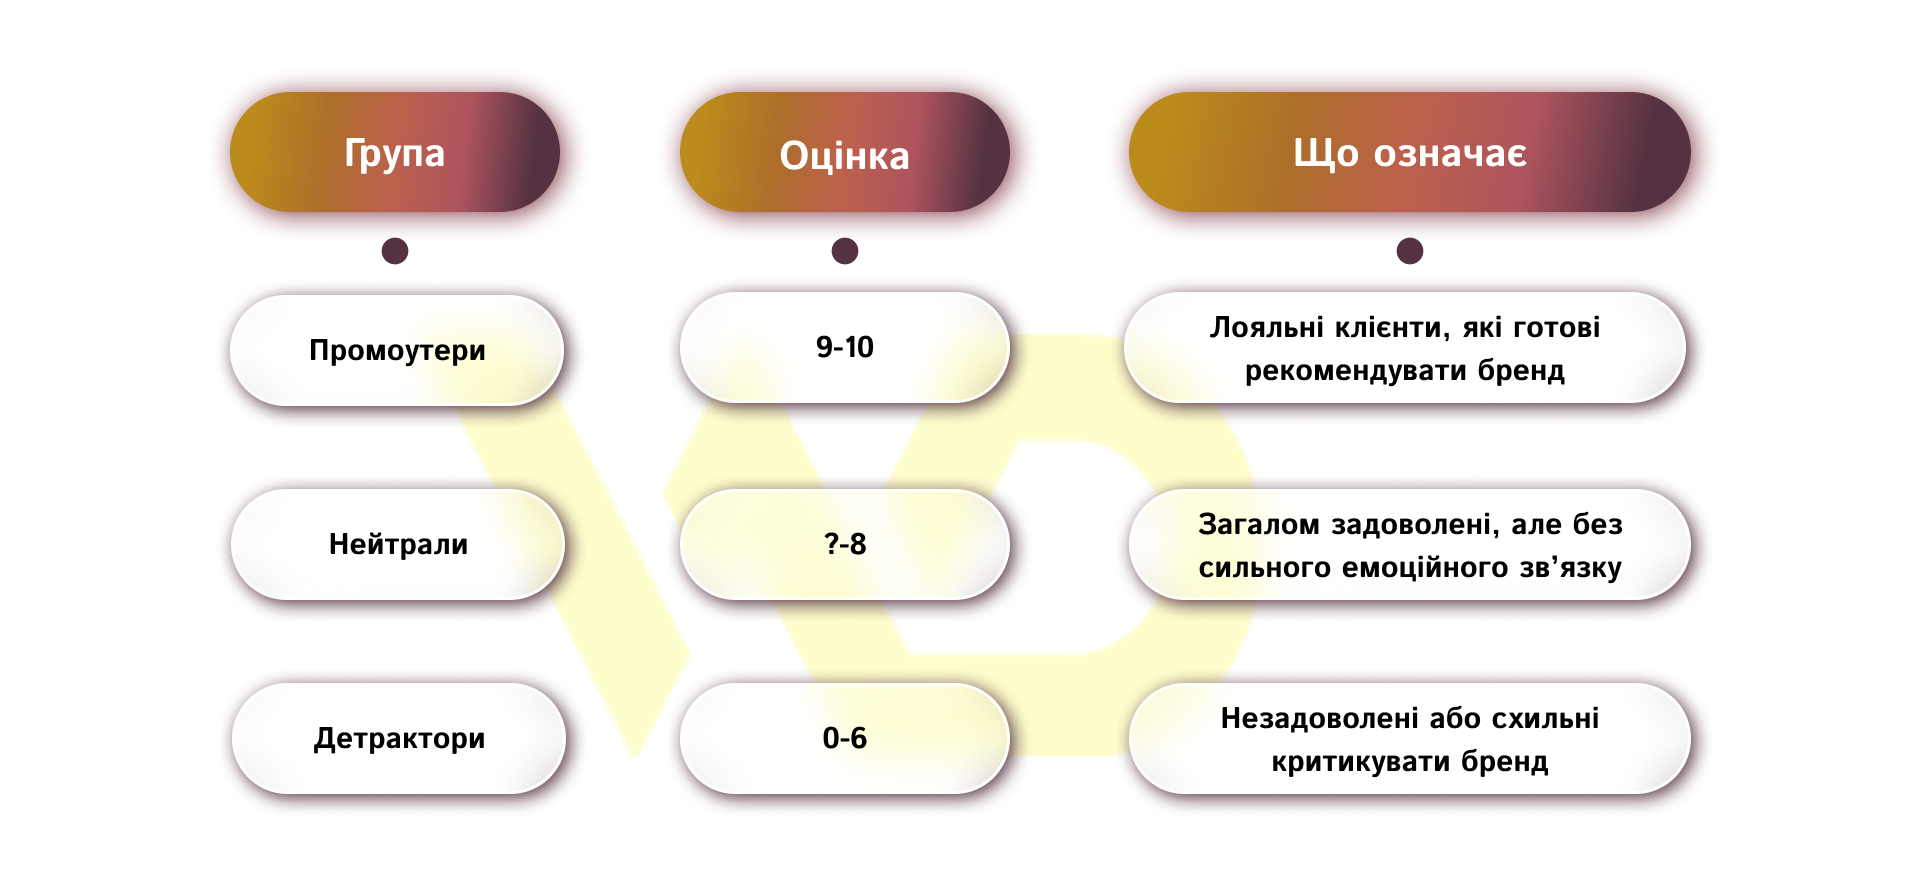
The customer loyalty index can be calculated using the following formula:
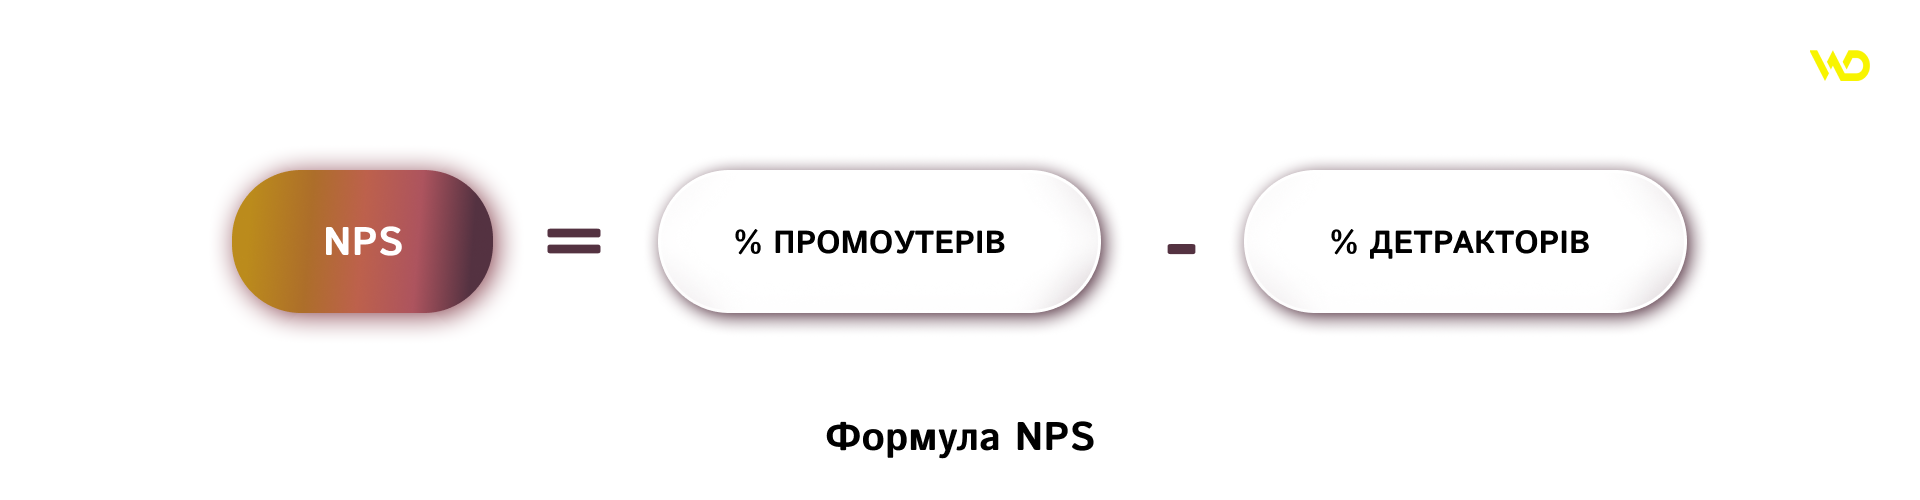
Let’s look at an example to illustrate this.
If a company received:
- 60% promoters;
- 25% passives;
- 15% detractors,
then NPS = 60 – 15 = 45.
The score can range from -100 to +100. The higher the score, the higher the audience’s level of loyalty.
What information does a business gain from NPS?
The main value of NPS lies not in the number itself, but in understanding customers’ attitudes toward the brand.
Through regular measurements, a company can:
- identify the risk of customer churn;
- assess reactions to changes in service;
- compare loyalty across different audience segments;
- identify weaknesses in the customer experience;
- track the impact of new products or promotions.
For example, if the NPS drops sharply after a change in delivery, this is a sign that the problem may lie not with the product, but specifically with logistics.
According to Bain & Company, high levels of customer loyalty are associated with faster organic business growth, higher customer lifetime value (LTV), and increased revenue. At the same time, research by NICE Satmetrix shows that companies with a higher proportion of promoters receive significantly more recommendations from customers, which positively impacts the acquisition of new customers and repeat sales.
How to properly conduct an NPS survey
For the results to be useful to your business, it’s important not only to ask the right questions but also to structure the survey process correctly.
It’s best to conduct the survey after an important interaction has concluded:
- a purchase;
- delivery;
- service activation;
- a support request;
- project completion.
At that point, the customer still clearly remembers their experience.
In addition to the main rating, it’s worth asking an open-ended question: «What influenced your rating?». It’s often the comments that provide more insights than the NPS score itself.
Important! It’s important to survey more than just your most active customers. If only very satisfied or very dissatisfied people respond, the results will be skewed. Therefore, the sample should include various segments of the audience.
Which channels to use for collecting NPS
The method used to collect responses has a critical impact on both the response rate and the quality of the data obtained.
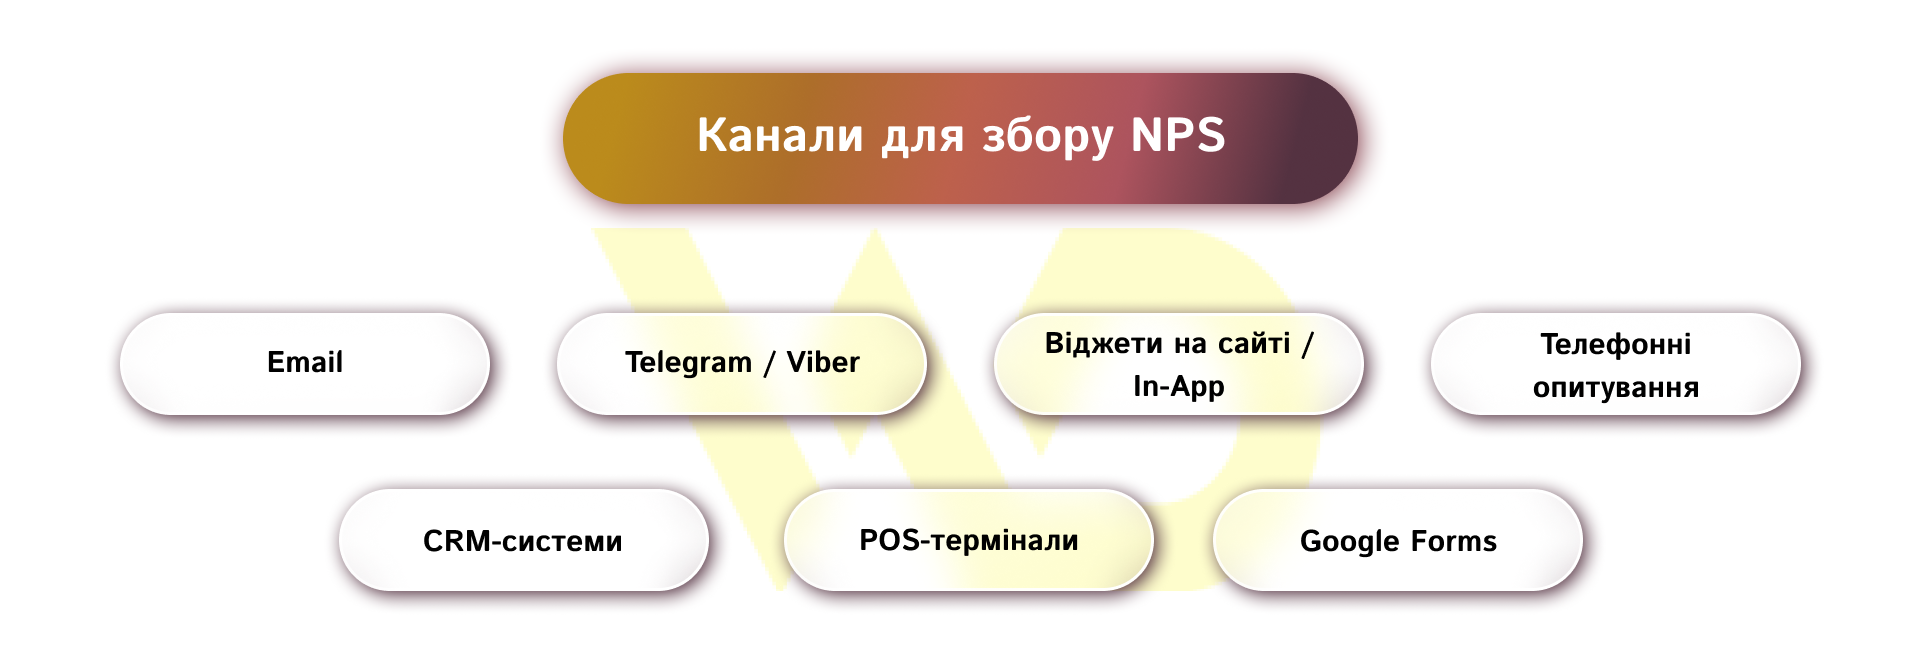
When choosing a tool, it’s important to consider the specifics of your business and your audience’s behavior.
|
Channel |
When to Use |
Average Response Rate |
|
|
After a purchase, delivery, or for regular (quarterly) updates. |
15–25% (highly dependent on brand loyalty). |
|
Telegram / Viber |
For an active digital audience that rarely checks email. |
30–40% (due to higher message open rates). |
|
Website widgets / In-App |
Directly while using the service or mobile app. |
40–60% (the highest result, since the customer is in context). |
|
Phone surveys |
For the B2B segment, VIP customers, and companies offering high-end services. |
10–20% (due to spam filters and reluctance to speak on the phone). |
|
CRM systems |
For automatic data collection immediately after a trigger event (closing a support ticket, etc.). |
Depends on the integrated channel (email/SMS). |
|
POS terminals |
Offline retail, stores, coffee shops, supermarkets. |
20–30% (while the customer is at the register). |
|
Google Forms |
For small businesses, manual surveys, and initial test runs. |
10–15% (requires too many extra clicks from the customer). |
*The figures provided are averages based on annual global customer experience (CX) market research from leading analytics platforms such as SurveyMonkey, Qualtrics, CustomerGauge, and Zonka Feedback. They reflect standard industry benchmarks for B2B and B2C companies worldwide.
For most companies, automated data collection via CRM using email or messaging apps is the most effective method, as it allows for regular data collection without manual effort. However, in addition to raw statistics, other factors should also be taken into account.
How to avoid turning surveys into spam
To ensure your metrics reflect the actual state of affairs — and don’t annoy your customer base — follow these three rules.
- The 24-Hour Rule. A survey about a specific transaction (delivery, purchase, or support conversation) should reach the customer «while the experience is still fresh». If you ask someone about service quality a week later, they’ll either forget the details or give a random rating.
- «Quarantine» for surveys. If a customer buys from you three times a week, there’s no need to send them an NPS survey after every purchase. Set a limit in your CRM: a user should see a survey no more than once every 30–90 days.
- The «One-Click» Principle. If you use email or messaging apps, integrate a 1–10 scale directly into the body of the message. Any request to click a third-party link to «fill out a survey on the website» instantly cuts the response rate by 30–40%.
Remember! High-quality NPS data collection depends on striking a balance between automation, precise timing, and respect for the customer’s time this approach guarantees clean data that can be used to make strong strategic decisions.
How to properly interpret NPS results
Obtaining the final NPS score is just the beginning of the analysis. The main mistake many companies make is treating this metric as a static value. For the score to benefit the business, the data must be broken down and examined in the context of internal processes.
Why you shouldn’t focus solely on the final number
The NPS score can be the same for companies with completely different customer experience structures. For example, if two companies have a score of +40, for the first one this might be the result of a survey where 50% of respondents are promoters and 10% are detractors. For the second company, 40% may be promoters, and 0% may be detractors. The operational strategies for these brands will be fundamentally different. The first company needs to urgently address critical service flaws that are creating toxic critics, while the second needs to focus on marketing and encourage neutral customers to engage more actively.
The importance of textual comments and trends
A numerical index alone merely indicates the presence of a problem but does not explain its cause. Responses to the open-ended question «What specifically influenced your rating?» allow reviews to be classified into categories:
- product quality;
- delivery speed;
- staff competence;
- user-friendliness of the interface.
In addition, measurements should be taken regularly, since only by analyzing the metric over time — on a monthly or quarterly basis — can you assess the real impact of changes in the business such as a website redesign or updates to loyalty program terms.
Data segmentation as a tool for identifying weaknesses
To gain objective insights, the overall NPS score must be broken down into separate analytical segments. It is advisable to analyze loyalty by specific regions or brick-and-mortar stores, assess satisfaction levels across different product categories, and compare user experiences based on sales channels (mobile app, website, or retail network).
This approach helps avoid the «positive NPS trap», where a high overall score driven by a large number of retail customers with low average transaction values masks the dissatisfaction of key VIP customers, the loss of whom could be critical to the company’s financial results.
How to turn NPS results into business changes
Collecting and analyzing data serves no practical purpose if the survey results remain confined to management reports. The primary value of the Net Promoter Score methodology is realized by launching a closed-loop feedback cycle that involves transforming the customer experience based on the information gathered.
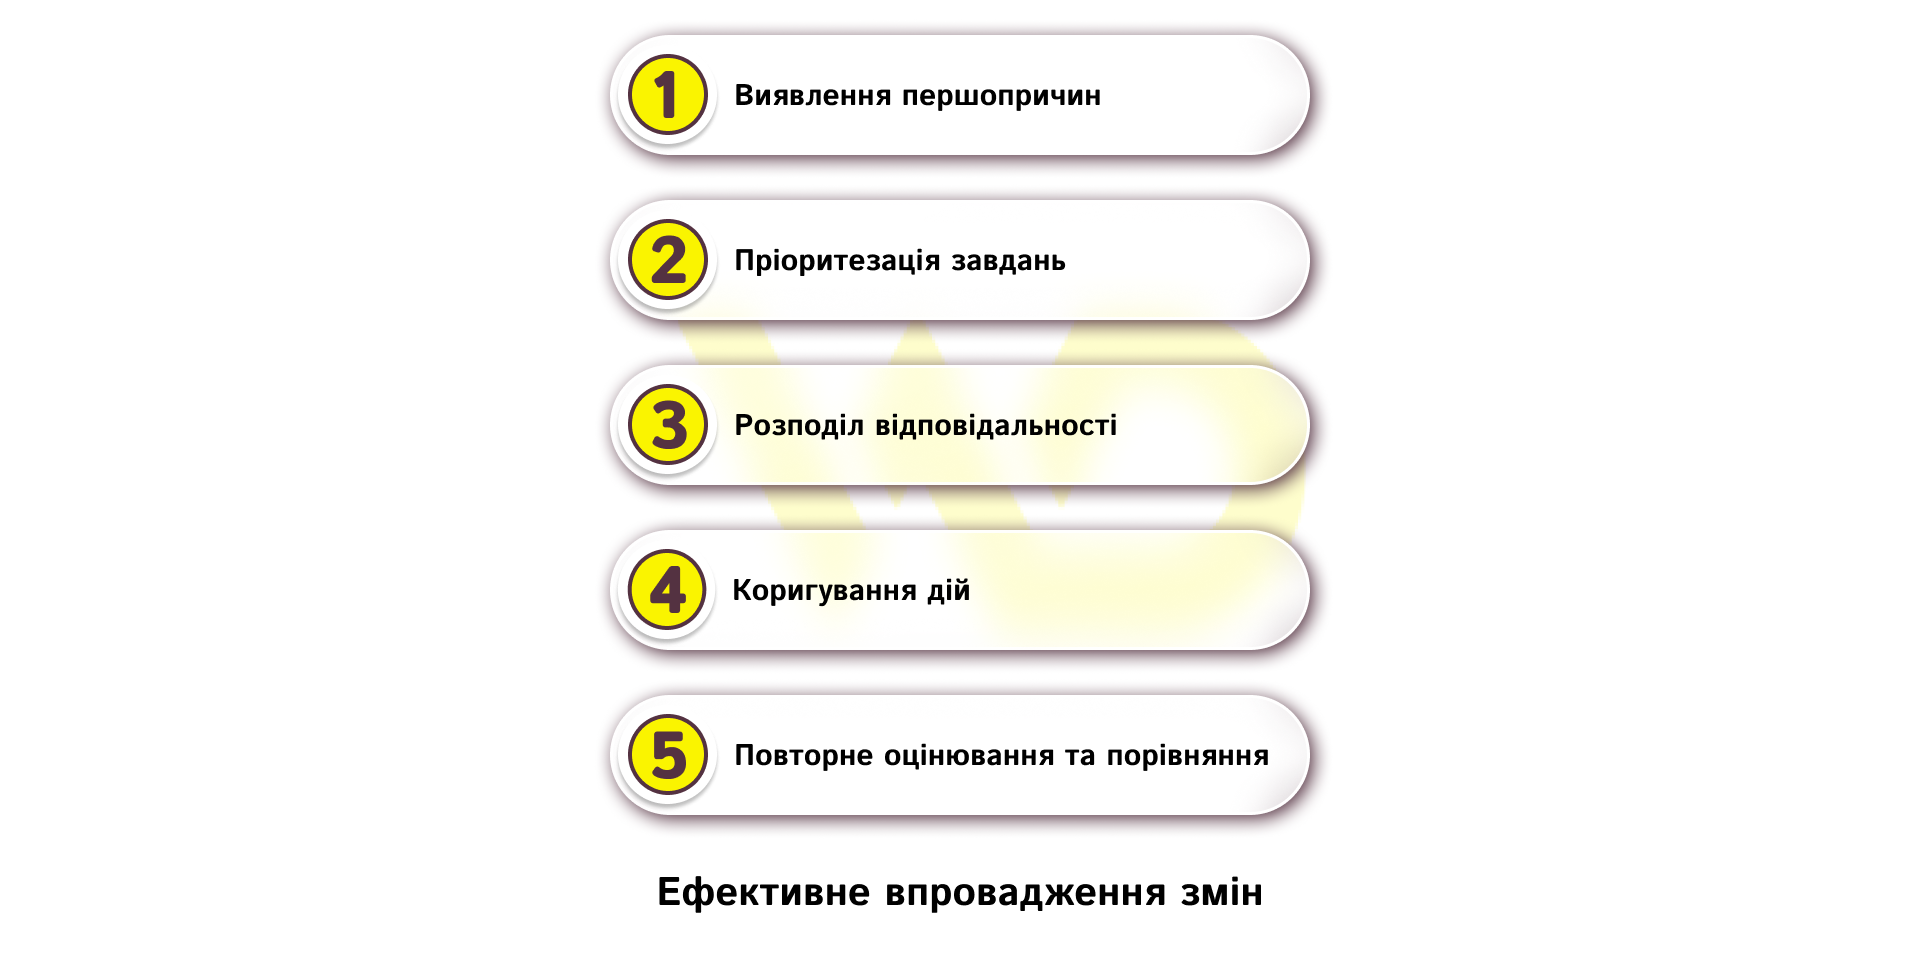
Effective change implementation requires a company to follow a clear sequence of steps:
- Identifying root causes. Based on text comments from critics, a list of systemic issues is compiled and grouped into categories to identify the weakest points in the service.
- Prioritizing tasks. Each problem is assessed in terms of its criticality to the customer and the resources required by the business to resolve it, which allows for the identification of top-priority tasks.
- Assigning responsibility. The insights gained are forwarded directly to the relevant teams: technical glitches to developers, complaints about service quality to sales managers, and product flaws to category managers.
- Adjusting actions. Based on the feedback, the company’s internal policies are revised, scripts are updated, or the technical stages of user interaction are improved.
- Re-evaluation and comparison. After the full launch of the updated processes, a follow-up survey is conducted to verify whether the implemented changes have affected rating trends and whether the proportion of negative feedback has been reduced.
Ultimately, the success of using the NPS tool is determined not by capturing the audience’s current loyalty, but by the company’s ability to adapt to its customers’ needs. Every piece of feedback is a clear and free guide for optimizing internal business processes. It is precisely the regular transformation of the data received into concrete steps to improve the product or service that enables a company to build a long-term competitive advantage and ensure stable growth in the market.

commercial offer
Other articles by the author

05/02/2026
Geotargeting is an algorithm that allows content or advertising messages to be shown to users based on their geographical location.

09/09/2026
A well-chosen domain name strengthens the brand, shapes customers' first impressions, and facilitates search engine optimization, whereas a mistake at the outset can cost a company lost traffic and reputational risks.

16/09/2026
Choosing between search engine optimization and pay-per-click advertising is one of the most critical decisions when developing a marketing strategy.
Latest articles by #Useful tips

02/10/2026
For businesses, CPL is the primary metric for measuring how effectively ads and landing pages convert cold traffic into initial leads.

24/09/2026
While feeds were previously viewed as a purely technical feature for running contextual ads in Google Ads, today their quality directly determines the share of impressions across all sales channels.
16/09/2026
Choosing between search engine optimization and pay-per-click advertising is one of the most critical decisions when developing a marketing strategy.