

 09/11/2026
 756

Інтернет-маркетинг
простою мовою
Content of the article

Sales forecasting: from classic formulas to AI analytics

Inaccurate estimates of future sales affect various aspects of business operations. A company may purchase too much inventory, fail to restock its warehouse before peak season, or spend its advertising budget on campaigns that won’t deliver the expected results. At the same time, a conservative forecast that doesn’t account for potential growth can limit business development.
To make informed decisions, companies need to assess not only what has already happened but also how results might change under certain conditions. To do this, they use both simple mathematical calculations and more complex analytical models.
In this article, we’ll explore how to forecast sales using traditional methods and modern AI analytics tools, what data is required, and how to choose the best approach for your business.
What is sales forecasting
Sales forecasting is the process of estimating future sales volumes of goods or services based on historical data, current metrics, and assumptions about the company’s operating conditions. Depending on the task, the following are forecasted:
- the number of orders;
- the volume of products sold;
- revenue or the expected total value of closed deals.
It is important to distinguish between a forecast and a sales plan. A forecast shows the result the company is most likely to achieve under certain conditions, while a plan sets the target the company is striving to reach. For example, an analytical assessment might project monthly revenue of 800,000 UAH, while the plan calls for reaching 950,000 UAH. The difference between these figures helps identify what additional steps the business needs to take to achieve its goal.
The practical benefits of forecasting extend beyond revenue planning. It helps allocate resources in line with expected demand and identify potential problems in a timely manner.
Key objectives of sales forecasting:
- financial planning: estimating future revenue helps forecast cash inflows, plan payments, and monitor working capital needs;
- inventory and production management: expected demand makes it possible to determine in advance purchase volumes, production capacity utilization, and warehouse space requirements;
- Team planning: the company can estimate how many managers, operators, or warehouse workers will be needed during periods of increased workload;
- Marketing budget allocation: Forecasts help estimate the expected number of orders or inquiries at different levels of advertising spend;
- Goal setting: A manager can compare the expected outcome with the desired one and determine what changes are needed in sales processes;
- risk assessment: multiple scenarios help prepare solutions in advance in case of a drop in demand or faster-than-expected growth.
For example, an online store anticipates an increase in demand for space heaters before the start of the winter season. A forecast based on last year’s sales, current orders, and inventory levels helps determine how many units of a product to purchase. This reduces the risk of product shortages during periods of high demand and avoids excess inventory after the season ends.
Thus, forecasting is useful not in and of itself, but as a basis for specific management decisions.
What data is needed for sales forecasting
The reliability of a forecast depends not only on the chosen formula or software but also on the information on which the calculations are based.
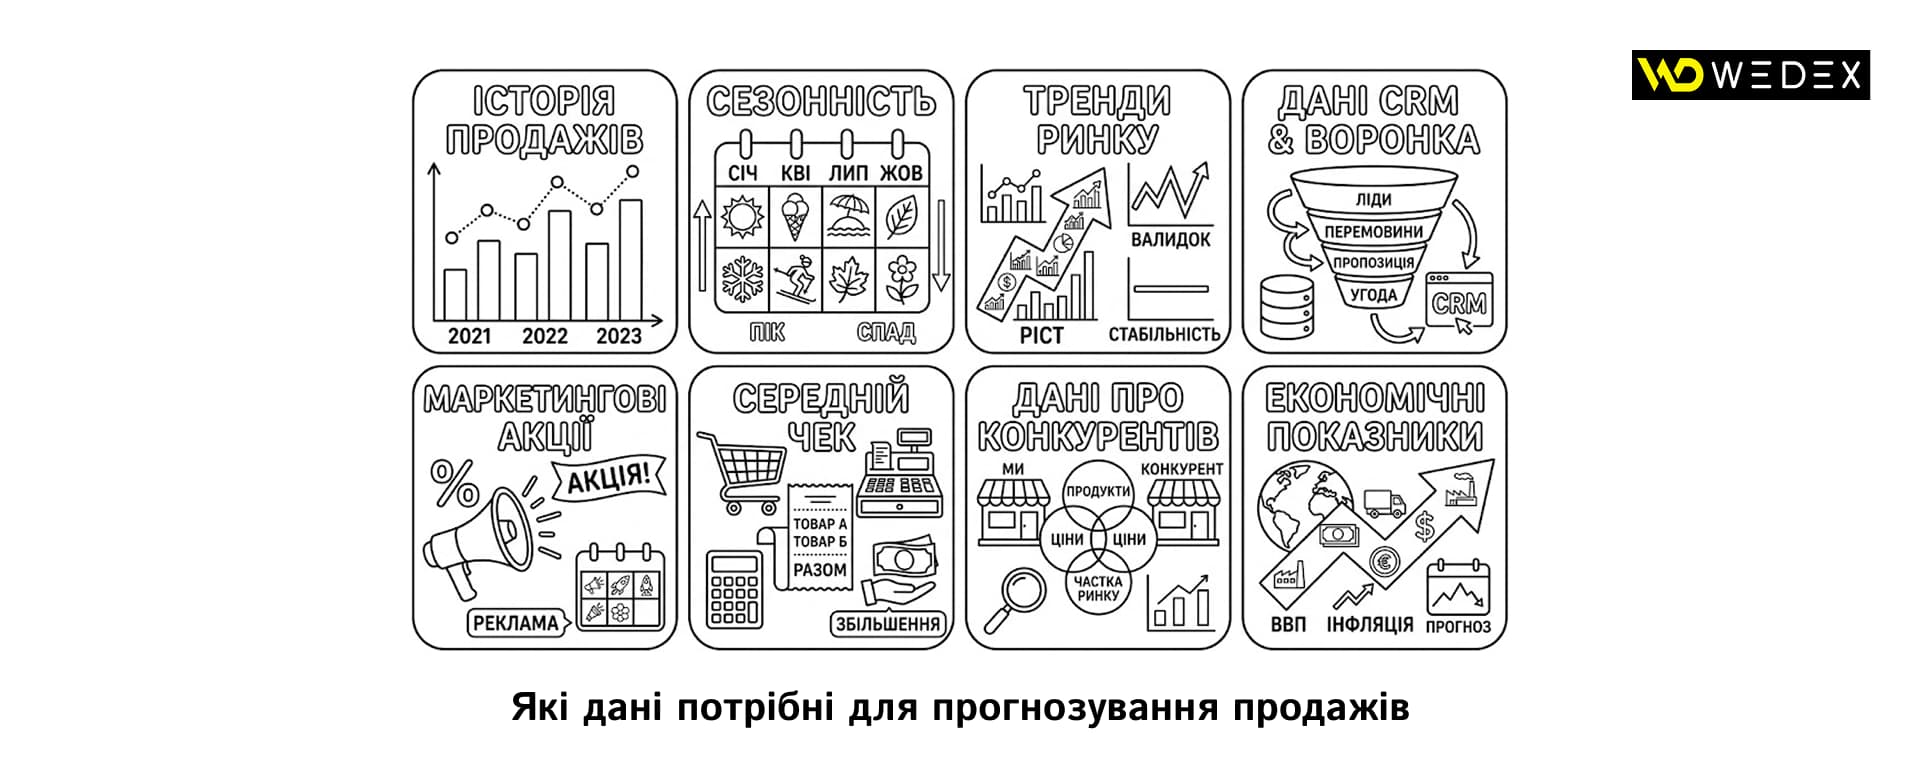
The more accurately a company tracks its sales history and the factors that influence it, the more opportunities there are for sound forecasting.
The following metrics are typically analyzed:
- sales volume by day, week, month, or quarter;
- number of orders, units sold, average ticket, and revenue;
- trends in prices, discounts, promotions, and product assortment;
- seasonality, holiday periods, and other recurring fluctuations in demand;
- number of inquiries, conversion rate, sales cycle duration, and deal stages;
- marketing expenses, traffic sources, and advertising campaign results;
- external factors, if their impact can be reasonably assessed and taken into account.
At the same time, the set of metrics depends on the business model. For an online store, it is important to know how individual products are selling, when inventory runs out, and how demand changes after promotions are launched. For a B2B company, metrics such as the value of potential deals, negotiation stages, the average time to close a deal, and the percentage of successfully closed opportunities may be significant.
Data quality is no less important. If some orders were not entered into the system, returns were not accounted for, or accounting rules changed during the year, the analysis results may not reflect reality. Similarly, distortions arise when a company compares periods of different lengths or fails to account for the fact that a particular product was temporarily out of stock.
A telling example is when, in a given month, a store sold half as much merchandise due to supply disruptions. If the model interprets this as a normal drop in demand, it may underestimate future sales even after inventory is replenished. Therefore, before performing calculations, it is necessary to identify the causes of unusual values, distinguishing real changes in demand from operational constraints.
To start with, it’s not necessary to collect every possible metric. It’s enough to determine exactly what needs to be forecasted, select the data that could influence the result, and verify that the data is complete.
Traditional sales forecasting methods The advantage of traditional methods lies in their straightforward logic, relatively low resource requirements, and the ability to quickly verify calculations. For example, you can analyze past sales, calculate averages over several periods, or account for seasonal fluctuations in demand. These approaches to time series analysis are discussed in detail in the textbook «Forecasting: Principles and Practice». At the same time, the accuracy of a forecast depends on the nature of sales, the quality of the data, and the stability of business conditions. So, let’s take a look at classic sales forecasting methods. 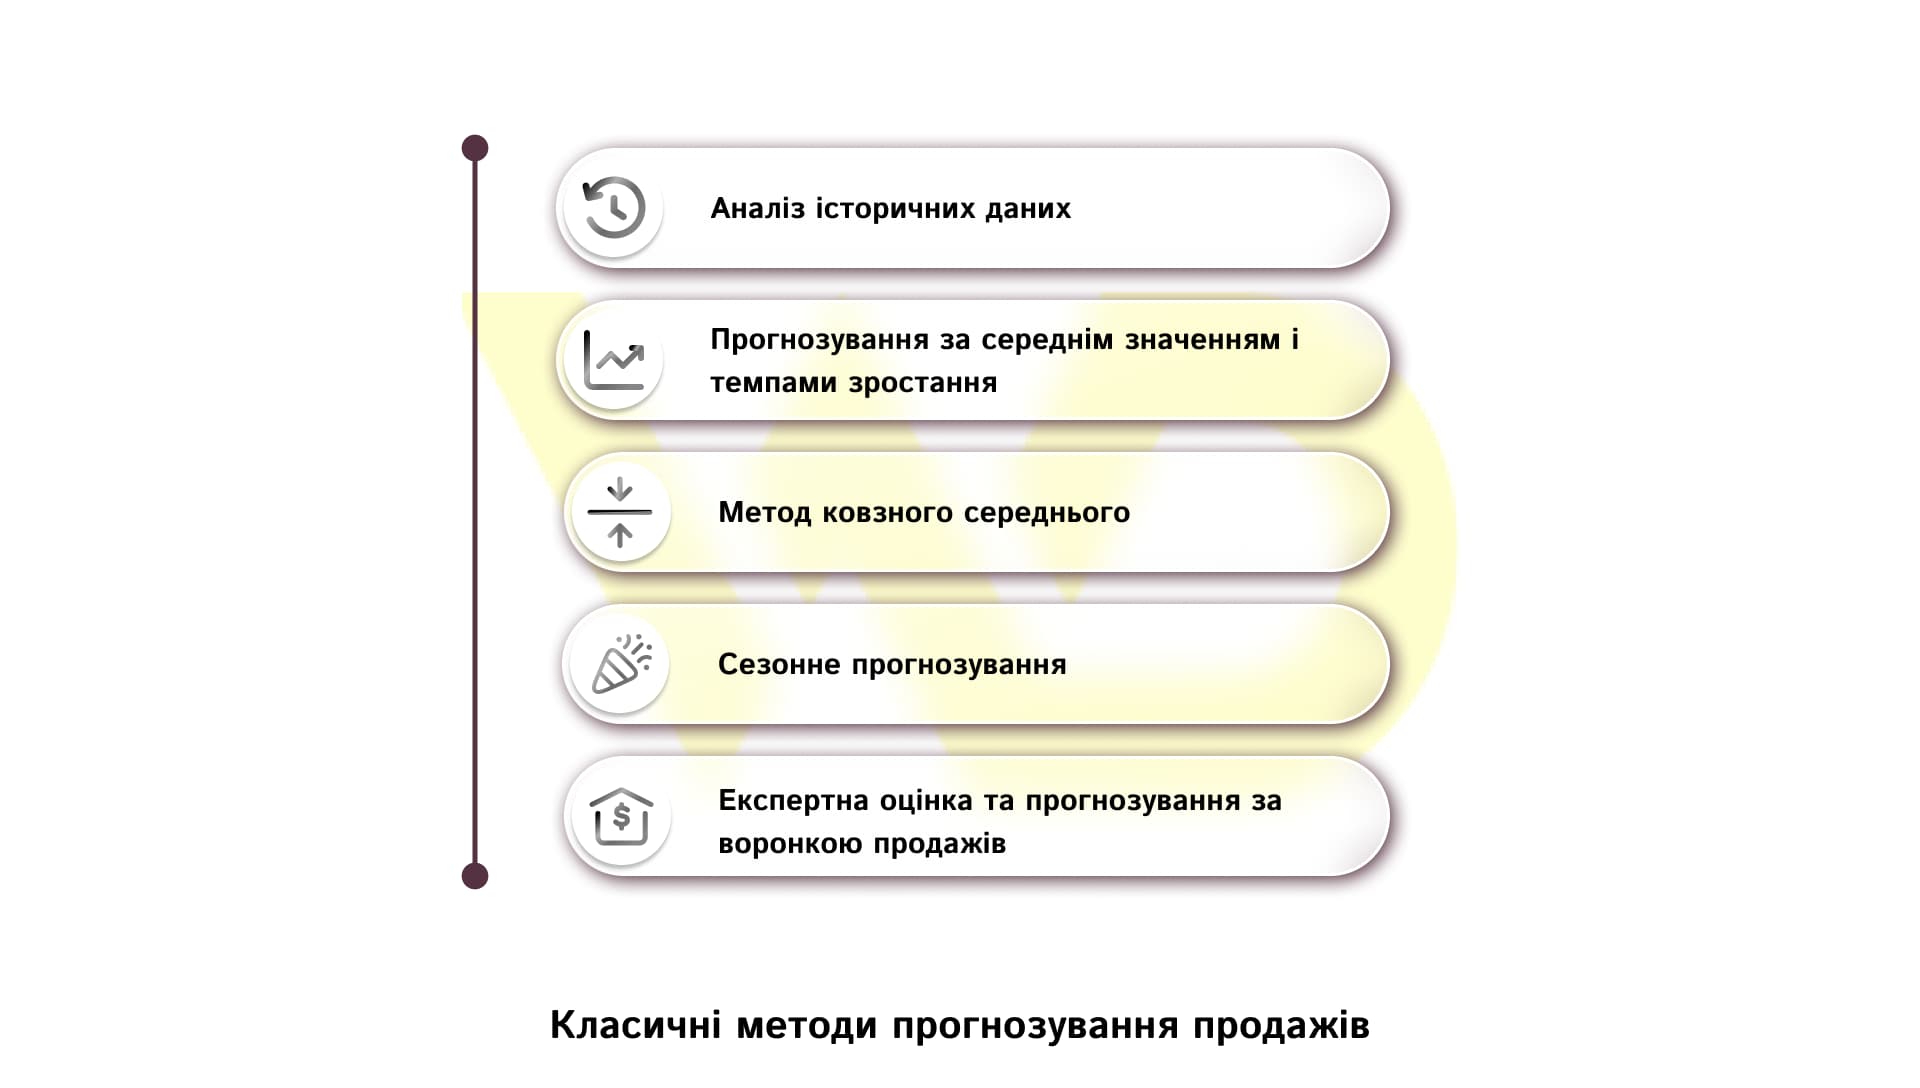
Analysis of historical data
One of the simplest approaches is to use past results as a benchmark for future periods. For example, if a company sells approximately 500–550 units of a product each month, this range can serve as an initial estimate of expected demand.
This approach is appropriate when a business operates under fairly stable conditions, has regular sales, and does not expect significant changes in prices, product assortment, or customer behavior. It can be used for preliminary estimates, procurement planning, or comparing actual results with typical sales levels.
However, the figure for the previous period alone does not explain why the result turned out that way. If sales increased due to a one-time large deal or a promotional campaign, mechanically carrying this figure over to the next month could create inflated expectations.
The advantage of this method is its simplicity, while its main limitation is its dependence on how closely past conditions align with future ones.
Forecasting based on average values and growth rates
If sales fluctuate from month to month, you can calculate the average over several periods. This helps determine a typical sales level and avoids being influenced by a single unusually successful or unsuccessful month. Forecasting based on the average is one of the basic quantitative methods described in the section «Some simple forecasting methods».
Suppose a company has reported the following monthly revenue figures for the last three months: 180,000, 210,000, and 210,000 UAH. The average would be:
Average revenue = sum of figures for the periods / number of periods.
180000+210000+2100003=200000 UAH
Therefore, the baseline forecast for the next month is 200,000 UAH, assuming there are no grounds to expect significant changes.
Another option is to estimate the result based on the growth rate. If revenue for the previous month was 200,000 UAH and a reasonable growth assumption is 5%, the calculation would be as follows:
Forecast = revenue for the previous period × (1 + growth rate / 100%).
200000×(1+0,05)=210000 UAH
Here, 5% represents the expected growth rate, not a guaranteed result. It can be justified by trends from previous periods, changes in the product lineup, or planned expansion of sales channels.
Both approaches are simple but have limitations. The average value does not reflect a clear upward or downward trend if one has already established itself. On the other hand, a forecast based on a growth rate can result in a significant margin of error if the selected percentage does not correspond to current conditions.
Moving average method
A moving average smooths out short-term fluctuations by averaging values over several consecutive periods. When a new value is received, the oldest observation is removed from the calculation, and the new one is added. Smoothing using a moving window of observations is described in the «Moving Averages» section of the textbook «Forecasting: principles and practice».
For example, a store sold 120, 150, and 180 units of a product over the last three months. The forecast for the next month based on a three-month moving average would be:
120+150+1803=150 units
This method helps avoid overemphasizing a single month with unusually high or low sales. It can be used for products with stable demand, recurring orders, or advance inventory planning.
The result depends on the length of the selected period. If you average the data over three months, the forecast will respond more quickly to recent changes. Over a twelve-month period, short-term fluctuations will have less of an impact, but new trends may become apparent with a delay.
In addition, a simple moving average does not automatically account for seasonality. If demand for a product traditionally increases in the winter, averaging summer and winter sales can skew the forecast for a specific season.
Seasonal forecasting
Seasonality is a recurring pattern of variation associated with specific periods. It can occur over the course of a year, a month, or even a week. For example, sales of gifts may increase before holidays, sales of travel goods may rise in the summer, and orders in certain retail segments may spike on weekends.
If demand exhibits pronounced seasonality, a comparison with the same period of the previous year is often more informative than a comparison with the previous month. In such cases, the seasonal naive method is used: the forecast for a given month or quarter is set equal to the actual figure for the corresponding season of the previous year. This approach is described in the section «Some simple forecasting methods».
A simple seasonal approach involves using the figure for the corresponding period of the previous year as an initial benchmark. For example, if a store sold 1,200 units of merchandise in November of last year, this can serve as the basis for the forecast for the current November. However, if the business has grown or changed its operating conditions, last year’s result must be adjusted.
Seasonality can also be combined with a long-term trend. Therefore, in more complex situations, it is assessed alongside the overall direction of sales changes.
Expert assessment and forecasting using the sales funnel
Not every business has a long sales history. For companies working with new products, entering a new market, or dealing with a long sales cycle, expert assessment becomes a key source of information.
A sales manager can take into account the experience of sales managers, ongoing negotiations, customer plans, and typical reasons for rejections. Such a forecast is useful when there isn’t enough statistical data, but it depends on the team’s competence and the validity of their assumptions. To reduce subjectivity, it’s worth verifying these estimates against actual results from previous periods.
Another tool is sales funnel forecasting. It is used to estimate the expected deal value, taking into account the deal’s value and the probability of closing. For example, in HubSpot’s documentation on setting up forecasting, the weighted deal value is defined as the deal’s value multiplied by the probability of successful completion.
For this method, it’s especially important to regularly update information in the customer management system. If managers don’t update deal stages or continue to assign inflated probabilities after delays in negotiations, even a mathematically correct calculation will be unreliable.
How to choose a forecasting method for your business
There is no single approach that would work equally well for every company. The method should be chosen based on the nature of sales, available data, the forecasting horizon, and the cost of a potential error.
Small businesses with a short sales history
If a company has been in operation for several months but does not yet have enough data to identify consistent trends, it is advisable to start with average figures, an assessment of current orders, and expert estimates. For a new product, it is helpful to further analyze the results of test sales. It is important not to treat a short history as a reliable model of seasonality: a few months are usually not enough to distinguish recurring patterns from random fluctuations.
Online store with a seasonal product range
For a store with regular product sales, it’s appropriate to compare data with similar periods in previous years and analyze trends. If there’s enough historical data, you can combine seasonal forecasting with a moving average or a specialized demand model. You’ll also need to take into account inventory levels, delivery times, promotions, and situations where product unavailability limited sales.
A B2B company with a long deal-closing cycle
Here, it’s important not only to analyze revenue by month but also to assess the state of the sales funnel. A forecast based on the weighted sum of deals helps identify potential revenue, while historical data allows you to verify how realistic the estimated closing probabilities are. If deals span several months, the forecast should be built based on expected completion dates, not just the total value of opportunities.
A company with a wide product range and a large number of transactions
If a business sells hundreds or thousands of SKUs, manually forecasting each one becomes labor-intensive. In this case, it’s worth automating data collection and comparing several methods using historical data. If sufficient resources are available, the company can use specialized forecasting models that estimate demand by individual products, categories, or regions.
In any case, it makes sense to start with a basic approach that can be tested. A more complex model is justified only if it yields better results based on the company’s data or significantly reduces the cost of preparing forecasts.
Sales forecasting using artificial intelligence
AI analytics can enhance traditional methods when it is necessary to process large volumes of data, account for many interrelated factors, and regularly update estimates.
Statistical models and machine learning algorithms can be applied to demand forecasting. For example, Microsoft Dynamics 365 describes several forecasting algorithms that differ in their operating principles and suitability for various types of data. This demonstrates that even within a single software environment, the choice of model depends on the structure of historical observations and the task at hand.
AI analytics can help in several areas:
- processing large datasets (analyzing sales history by product, region, sales channel, or customer segment);
- identifying patterns (correlations between demand and variables such as price, day of the week, season, or advertising activity);
- forecasting at various levels (total revenue, the number of orders in a specific category, or demand for a particular product);
- testing scenarios (how the calculated result will change given specific values of input indicators);
- regular updates (forecasts can be recalculated as new information becomes available, provided the system is integrated with data sources and configured accordingly).
However, not every AI-powered tool supports all of these features. Capabilities depend on the software, data quality, available integrations, and model settings. Furthermore, a detected correlation does not necessarily indicate a causal relationship.
Generative AI and predictive models: what’s the difference
It is important to distinguish between generative AI and specialized predictive systems. Generative tools, particularly text-based assistants, can explain metrics, help process tables, formulate hypotheses, create scenarios, and prepare analytical conclusions. However, their responses alone do not constitute proof of a prediction’s accuracy.
A specialized predictive model works differently. It is trained on data, uses a specific algorithm, and calculates future values based on identified patterns. The results of such a model can be systematically compared with actual sales and validated using data not used during training.
Therefore, a text query to a chatbot can be a useful tool for an analyst, but it should not automatically be considered a full-fledged replacement for a proven forecasting system. Before uploading commercial data to an external service, you should also review the terms of data processing, access rules, and the company’s privacy requirements.
How to make sales forecasting a practical business tool
High-quality forecasting starts with a clear objective and reliable data. For stable sales, simple calculations may suffice, whereas a wide product range and significant transaction volumes may justify the use of automated models and AI analytics.
To ensure the forecast remains useful, it’s important to regularly compare it with actual sales and adjust the calculations.
Practical tip! Start with a single metric, such as the number of orders per month. Build a baseline forecast, test its accuracy against past periods, and only then decide whether your business needs more sophisticated tools.

commercial offer
Other articles by the author

16/04/2026
This is particularly important in business content, as the text must not only be grammatically correct but also serve a specific purpose.

09/11/2026
AI is no longer just a technological trend for large corporations; it has become a practical tool for small and medium-sized businesses.

06/05/2026
DNS, or the domain name system, is a hierarchical system that helps a browser find the correct IP address for a domain.
Latest articles by #Useful tips

29/10/2026
Effective business storytelling structures information in such a way that the reader can sense the brand's evolution and the logic behind its decisions.

06/10/2026
From a business perspective, updating content is a sensible way to protect existing investments.

30/09/2026
Google's main focus in 2026 was the large-scale rollout and deep algorithmic integration of the AI Overviews (AIO) tool.